KronoGraph logoKronoGraph
ReactPlain JS
  • Showcase
  • Storybook
  • Playground
  • Docs
  • API
  • Download
  • Support
  • All
    API
    Docs
    Demos
    Blogs
    Webinars
  • Log in
KronoGraph logoKronoGraph
ReactPlain JS
  • Log in
  • Showcase
  • Storybook
  • Playground
  • Docs
  • API
  • Download
  • Support

Choose your framework

JS

Documentation for plain JavaScript projects

React

Documentation for React projects

Introducing KronoGraph

KronoGraph allows you to design interactive, scalable JavaScript timelines to explore evolving relationships between unfolding events.
Explore the introduction demo to understand how interactive timelines can help drive your investigations.
KronoGraph introduction demo
Take the tour
KronoGraph introduction demo

See what can be achieved with KronoGraph - explore our showcase demos

Explore views of your data

Explore views of your data showcase
Integration playground

Analyze team performance

Analyze team performance showcase
Business process analysis

Tell the story of a network

Tell the story of a network showcase
Phone call analysis

See alerts in context

See alerts in context showcase
Detection and response

Log Visualization & Analysis

Log Visualization & Analysis showcase
Observability platform

Find suspicious sequences

Find suspicious sequences showcase
Credit card fraud

Trace issues to the source

Trace issues to the source showcase
Supply chain investigation

Uncover hidden patterns

Uncover hidden patterns showcase
Email analysis

Bring log files to life

Bring log files to life showcase
Network traffic analysis

Follow the money

Follow the money showcase
Anti-money laundering

Communicate rich narratives

Communicate rich narratives showcase
Crime investigation

Prove prior knowledge

Prove prior knowledge showcase
Insider trading

Track movements over time

Track movements over time showcase
Geospatial timelines

Explore OSINT in a new way

Explore OSINT in a new way showcase
Social media analysis

Gain perspective on big data

Gain perspective on big data showcase
Worldwide terrorism dataset

Get started; build something

link to storybook

Storybook

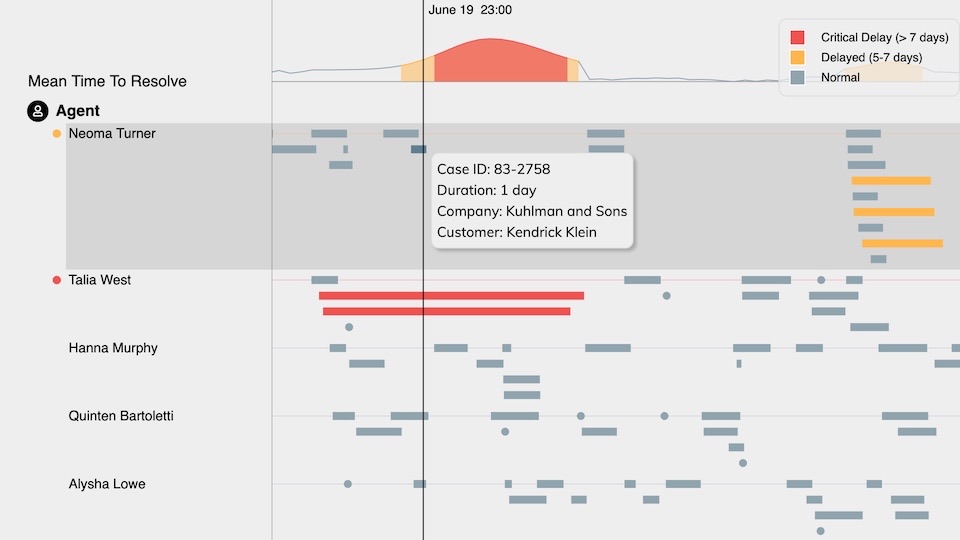
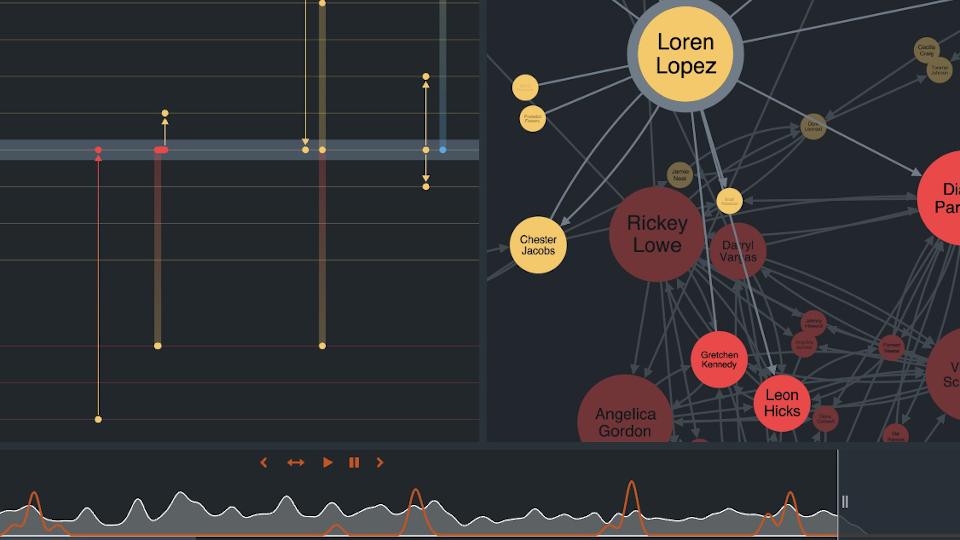
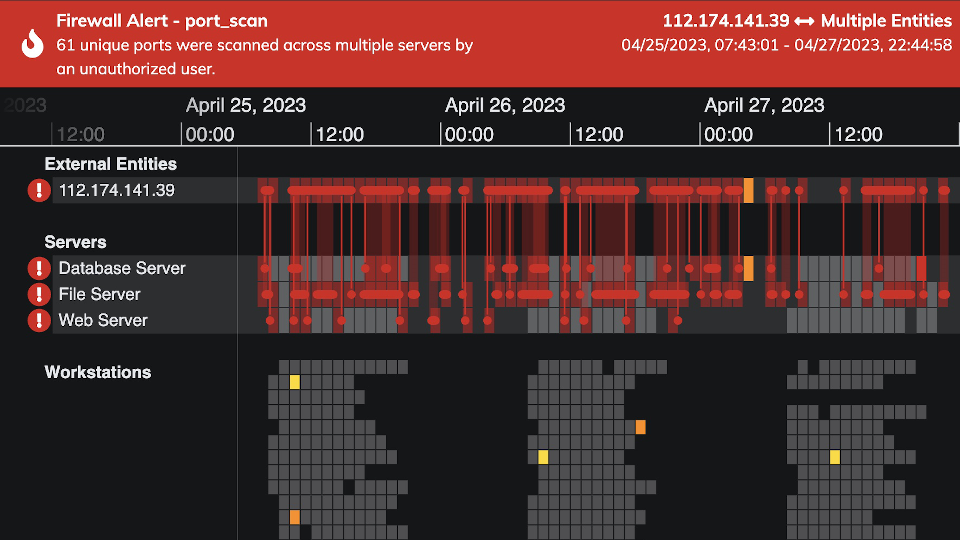
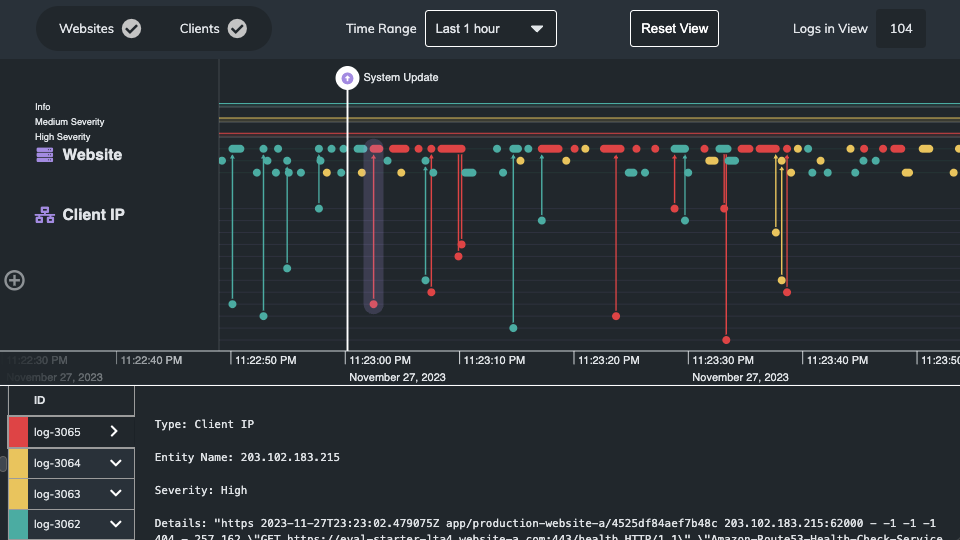
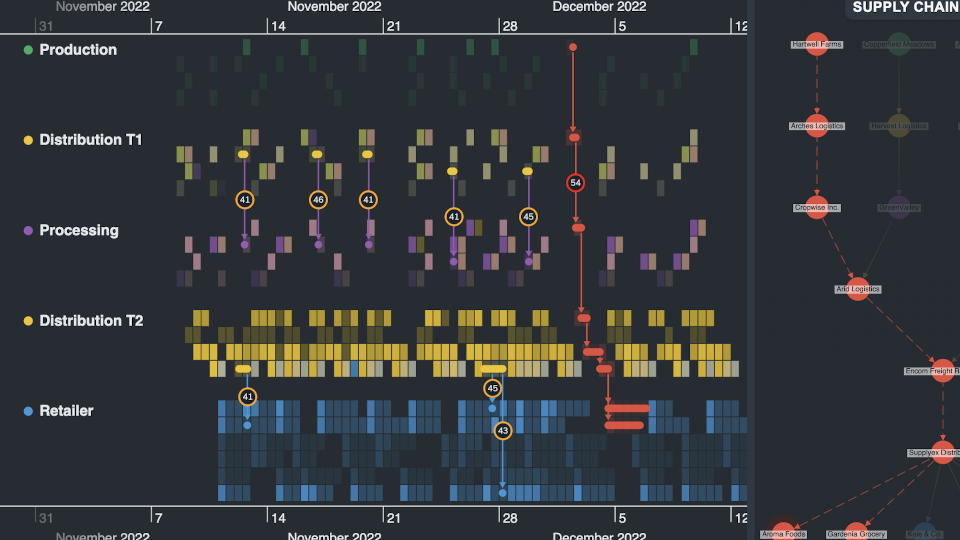
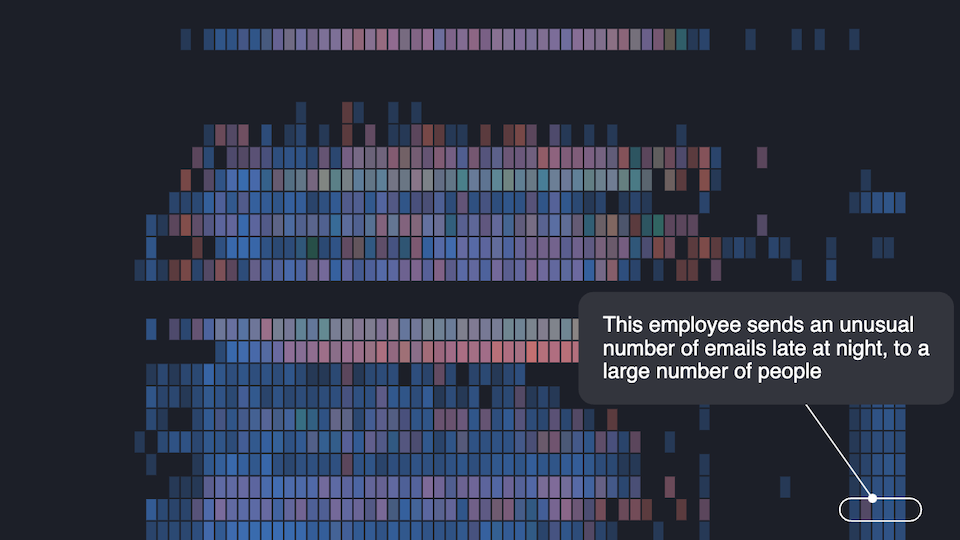
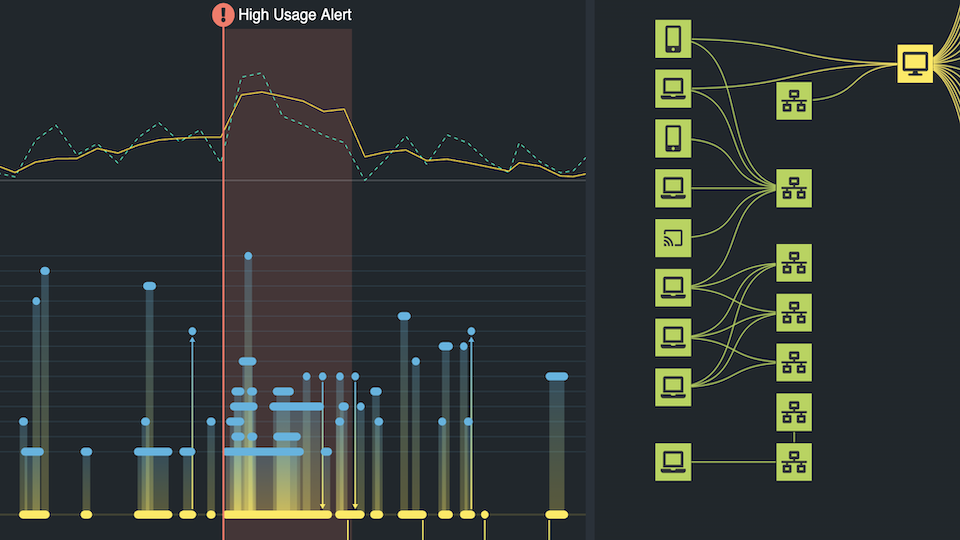
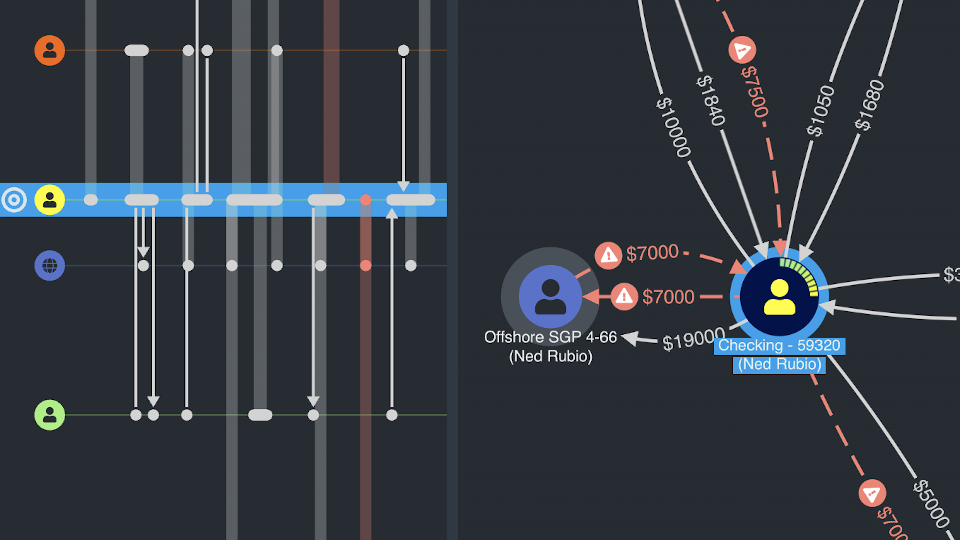
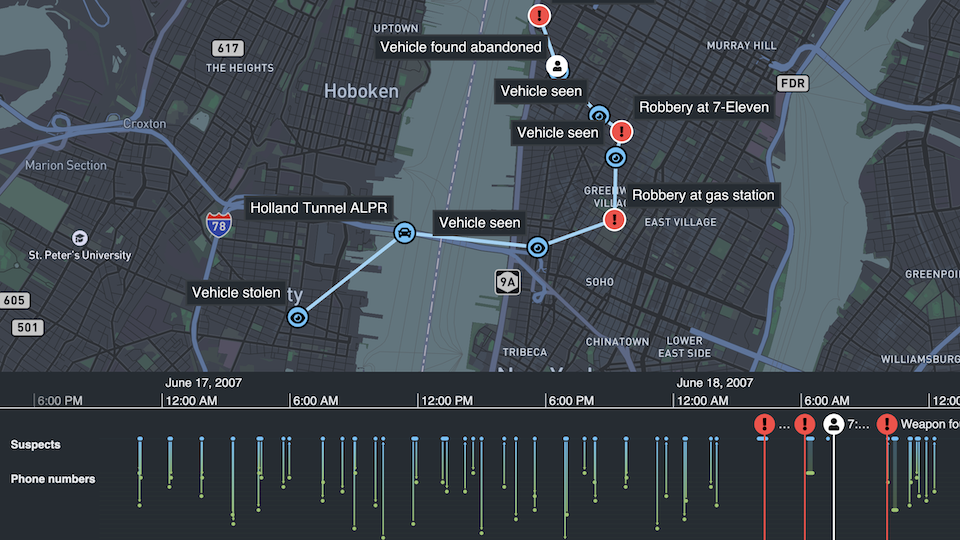
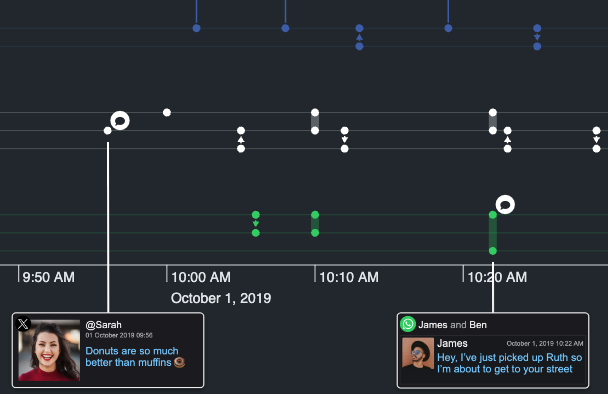
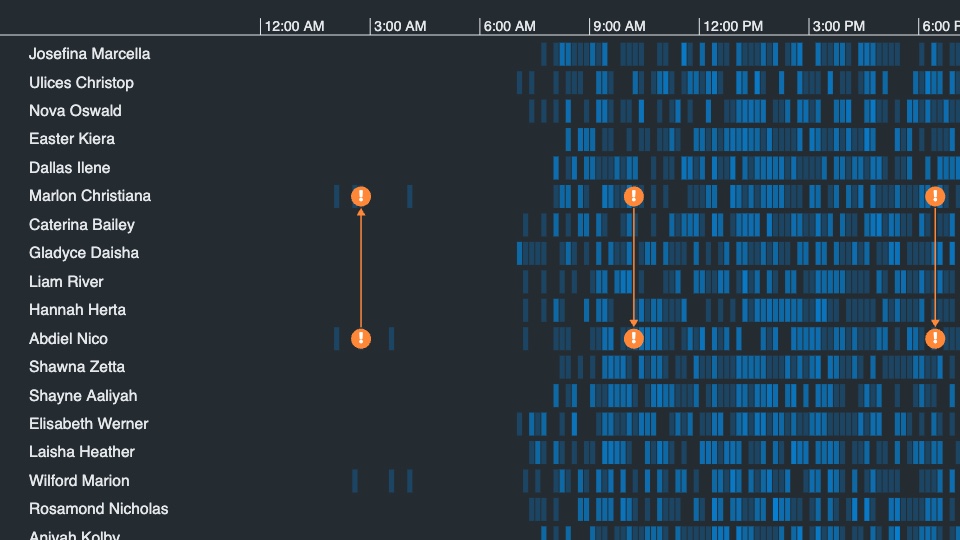
View in-depth demos of KronoGraph's features.

link to playground

Playground

Play with some code in our live editor.

link to docs

Docs

Read more about the features available in KronoGraph and how to use them.

link to API reference

API reference

View the properties and functions available in KronoGraph's API.

link to download KronoGraph

Download

Download KronoGraph and follow our instructions on how to add it to your project.

link to support information

Support

Get help with technical queries, bugs, feature requests and more.

You're in good company

Our graph visualization software is trusted by governments, global leaders, and fast-growing start-ups.

CiscoVisaMicrosoftFicoCifasZurichExperianHitachiDeloitteBAE SystemsSymantecNorthrop GrummanMcAfeeNuixHM GovernmentUS Department of Homeland SecurityWestern UnionCarabinieriAIGAustralian GovernmentC3
Cambridge Intelligence logo
All material © 2025 Cambridge Intelligence, 6-8 Hills Road, Cambridge, CB2 1JP, UK
Registered in England and Wales with Company Number 07625370
VAT Number 113 1740 61
Use/access of the Content on this website is subject to our Terms of Use.
v3.6.0