Choose your framework
JS
Documentation for plain JavaScript projects
React
Documentation for React projects
To use KronoGraph in your project, download and install it as a local package.
If you are upgrading KronoGraph from previous versions (v2.X), your code might need some changes. Our Breaking Changes and Removed API notes will help you upgrade.
Can't upgrade right now? You can find older versions of KronoGraph here.
Want to learn more about how to build your own application?

If you're using large datasets, our new Performance Tips section also outlines design tips and tricks for optimizing the performance of your KronoGraph app so that you can scale up your data efficiently.


It allows you to customize your lens control appearance more easily, replacing
a previous workaround that used an entityType labelColor to specify it indirectly.
If you used this, you can preserve your lens color by setting
color to the value of your
default entityType labelColor.
We are ending support for Windows 10 from 31 March 2026, following Microsoft ending support for Windows 10 . See Supported platforms & operating systems for details.
undefined, their default values are now applied.
This feature has been released in beta, which means it's fully functional, but could be subject to change. If you have any feedback or questions, please let us know via support.
We have renamed the
selection API to eventSelection
the selection prop to eventSelection
for clarity.
It remains fully supported for now, but we recommend that you replace it.


This feature has been released in beta, which means it's fully functional, but could be subject to change. If you've got any feedback or questions, please let us know via support.
npm to install the download bundle has been fixed.

npm, yarn and pnpm which will automatically offer up the correct code snippets.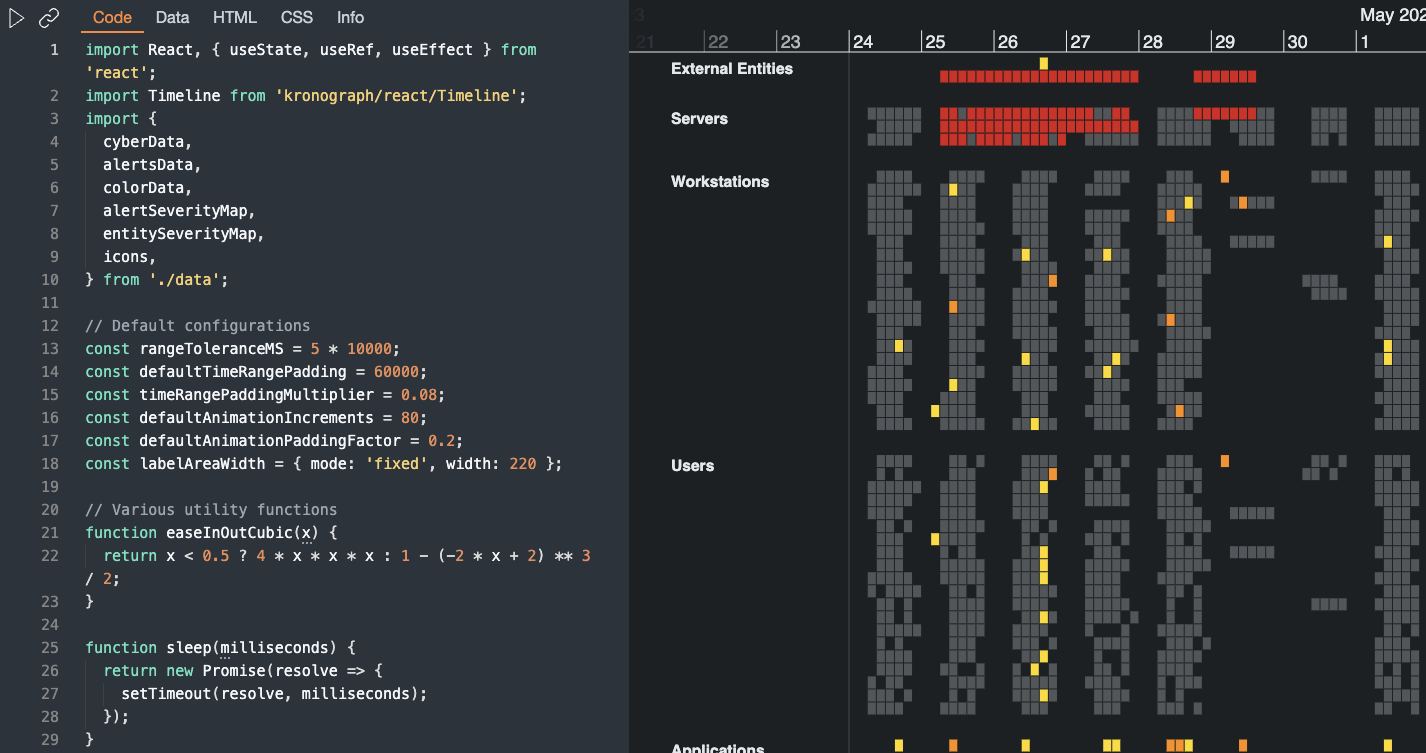
y coordinates when called within the
range event.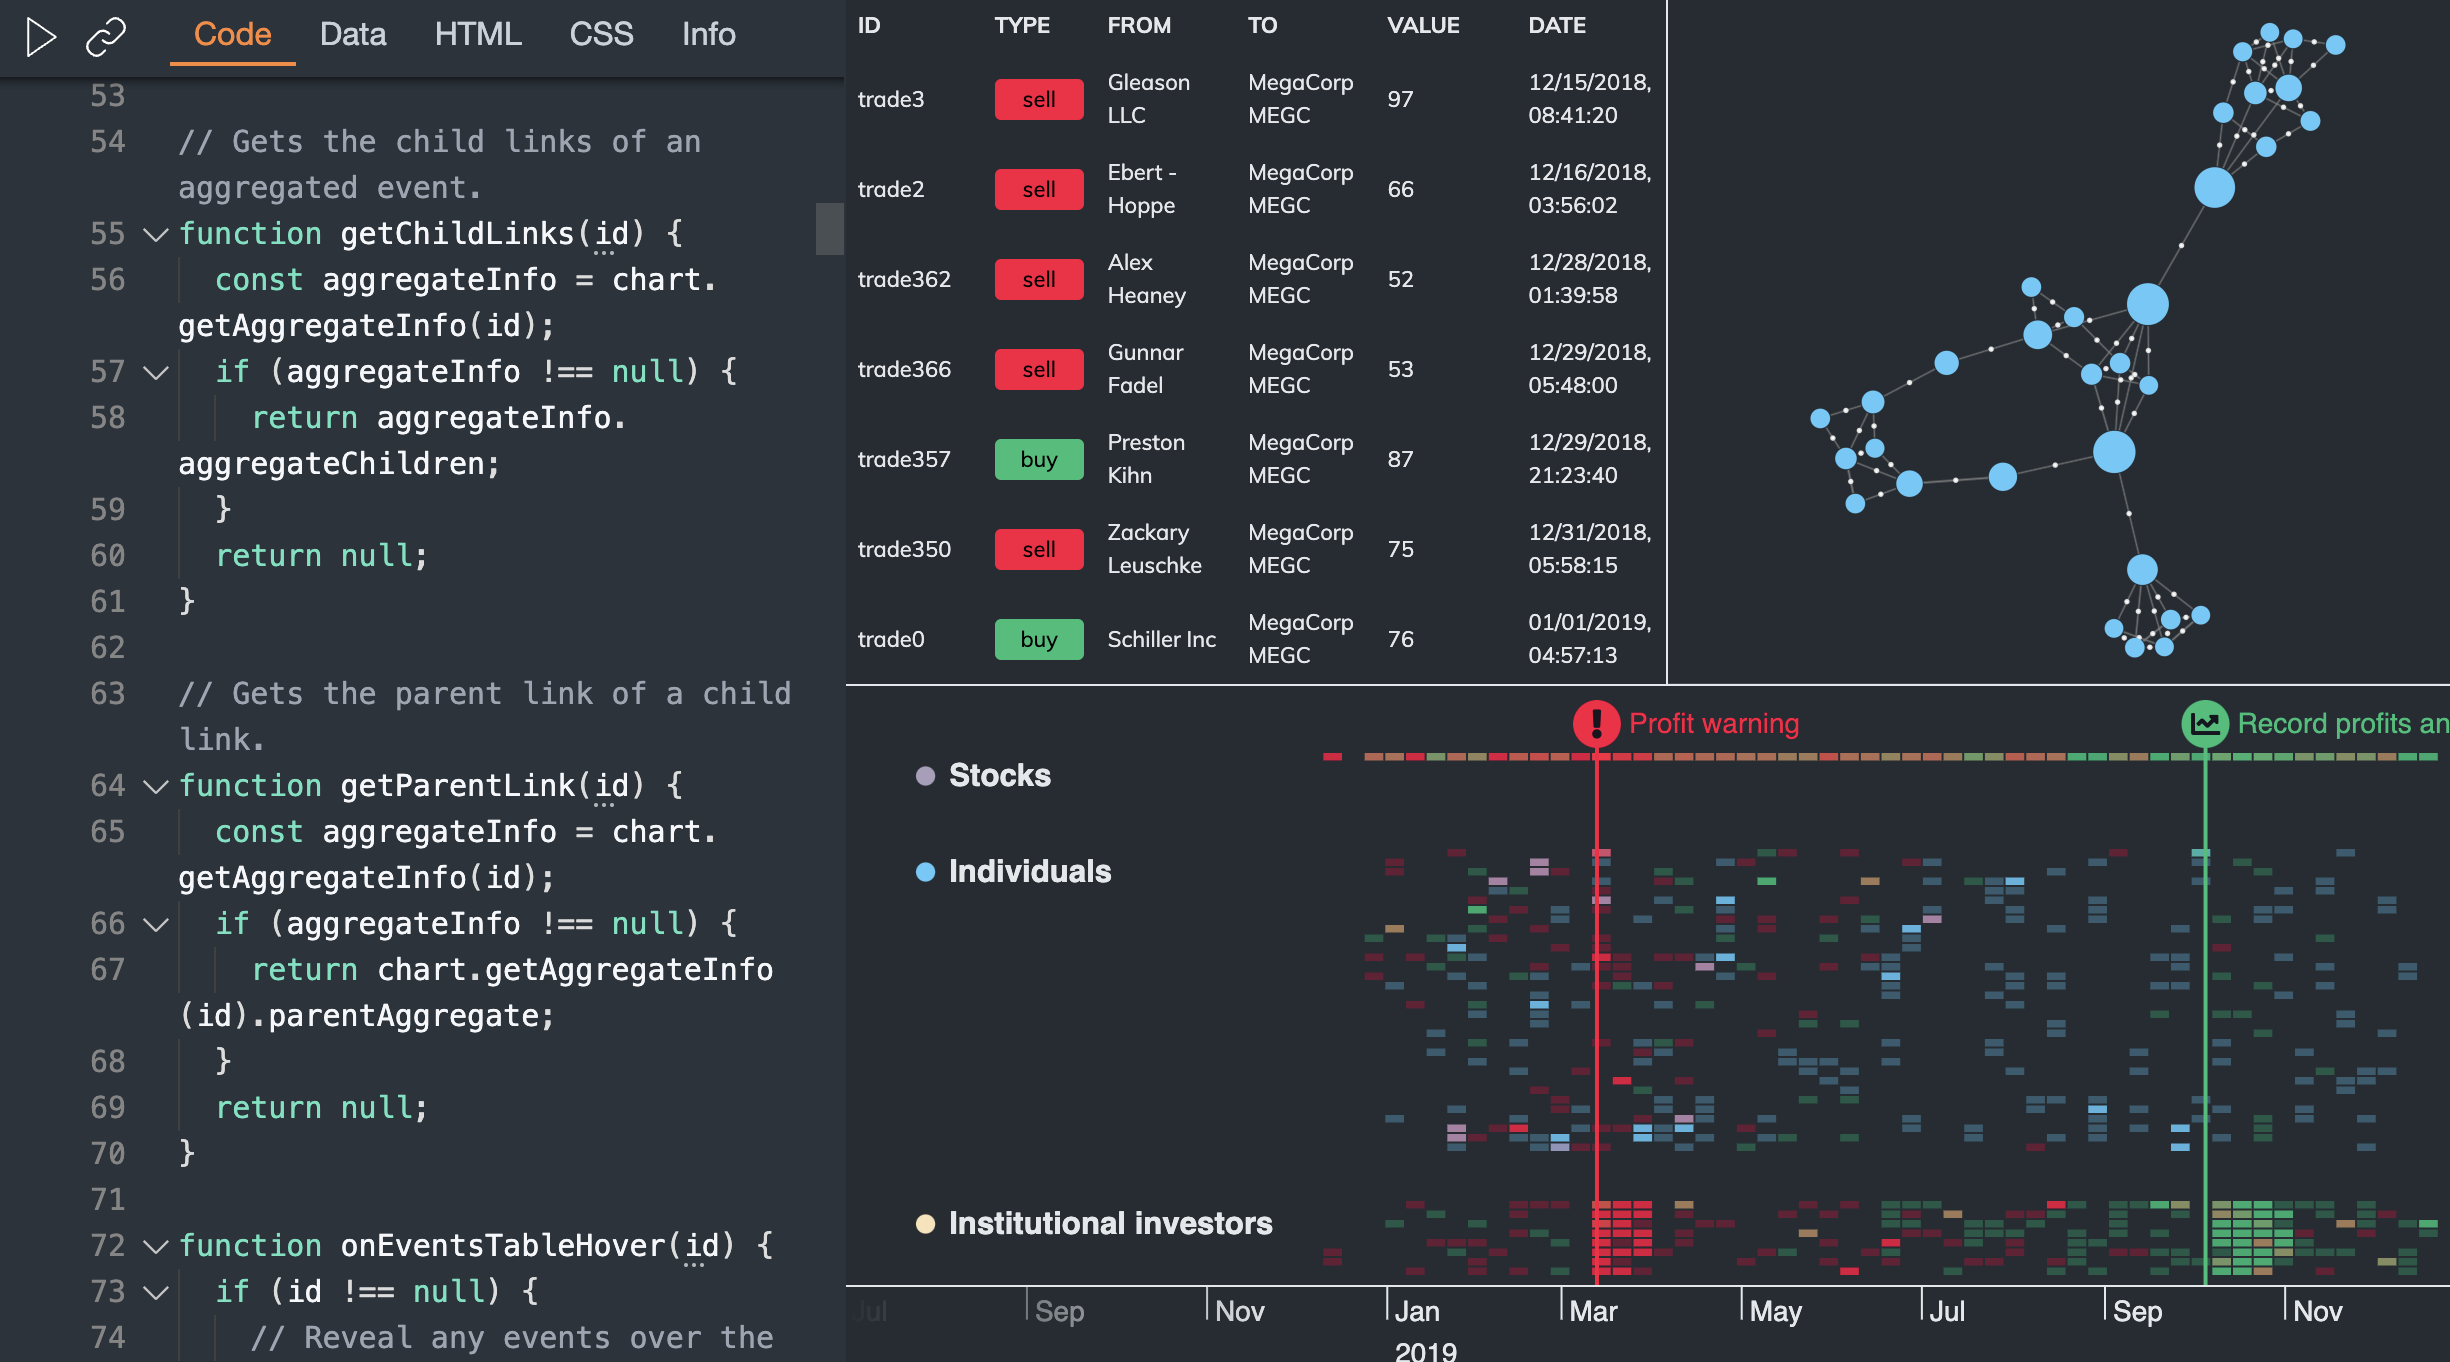
Have you ever wondered how we make our showcase demos work with KeyLines? We've created an Integration Playground so you can take a look. It's fully commented, so you can learn how the interactions between the chart and the timeline work. You can even add your own data, just make sure that it's in the correct KronoGraph format.
Have you ever wondered how we make our showcase demos work with ReGraph? We've created an Integration Playground so you can take a look. It's fully commented, so you can learn how the interactions between the chart and the timeline work. You can even add your own data, just make sure that it's in the correct KronoGraph format.
Based on customer feedback, we have introduced a minor breaking change to the annotations in beta.
The value passed to the id property
in the event handler of KronoGraph events
no longer varies for different interacted annotation parts
and it now always contains the id of the annotation.
Instead, to show which part of the annotation was interacted with,
we've added new possible values for the the targetType property
in the event handler which include 'annotationBody', 'annotationDeleteButton'
and 'annotationEditButton'.
See Handling Events for more details.
See Handling Events for more details.
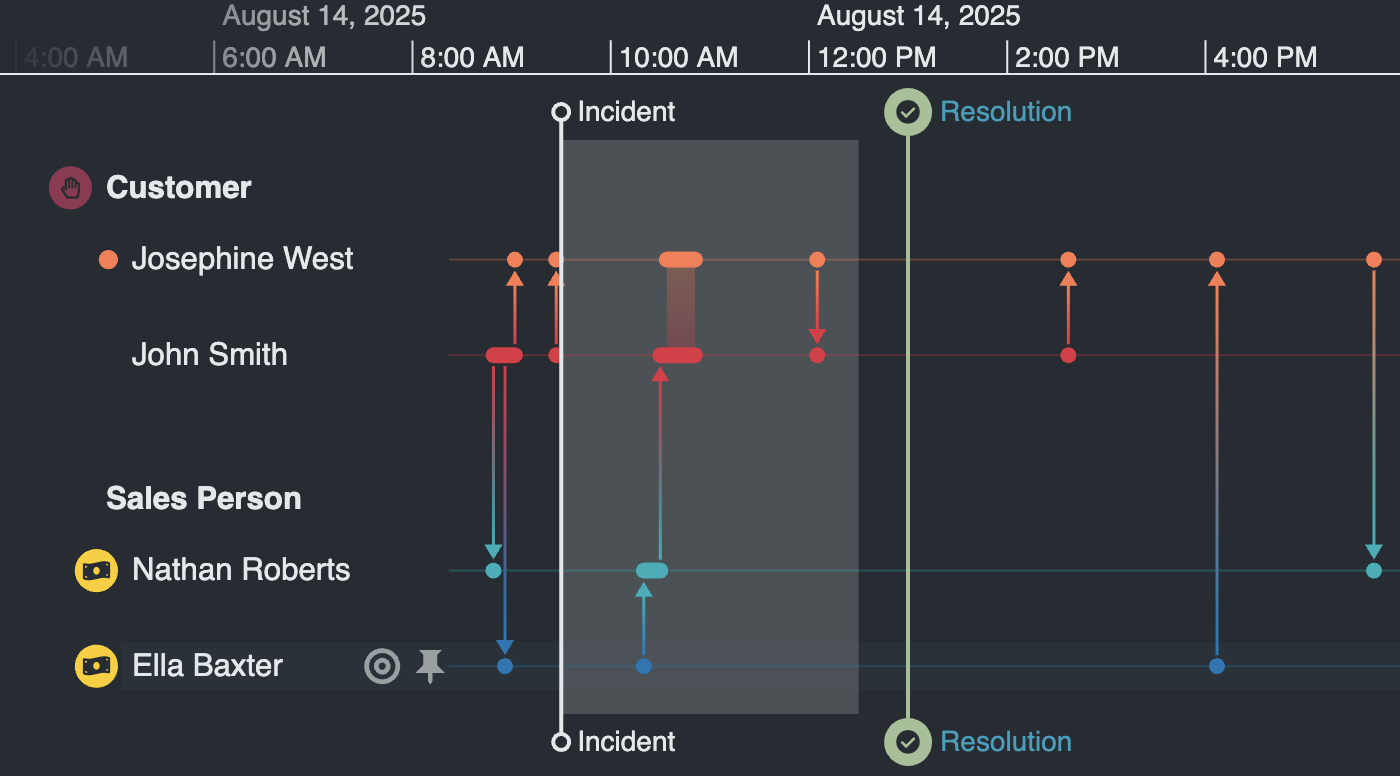
Our powerful new annotations feature reveals the story of your visualized data. Annotating key events adds context to the timeline, making the data more accessible and understandable.

You can either bring annotations into the timeline automatically as your data loads, or add them to key data points to highlight what's important. We've added annotations to our existing showcases to inspire you, including the Worldwide Terrorism demo, the Email Analysis demo and the Credit Card Fraud demo.
The new annotations annotations API provides the flexibility to style and position annotations on your timeline and tie them in to your overall product design. Take a look at the Styling Annotations example to try out some of the options.
To get started, dive into the Annotations docs and create your annotated timeline.
Annotations has been released in beta. This means that it is fully functional, but could be subject to change. If you've got any feedback or questions, please let us know via support.
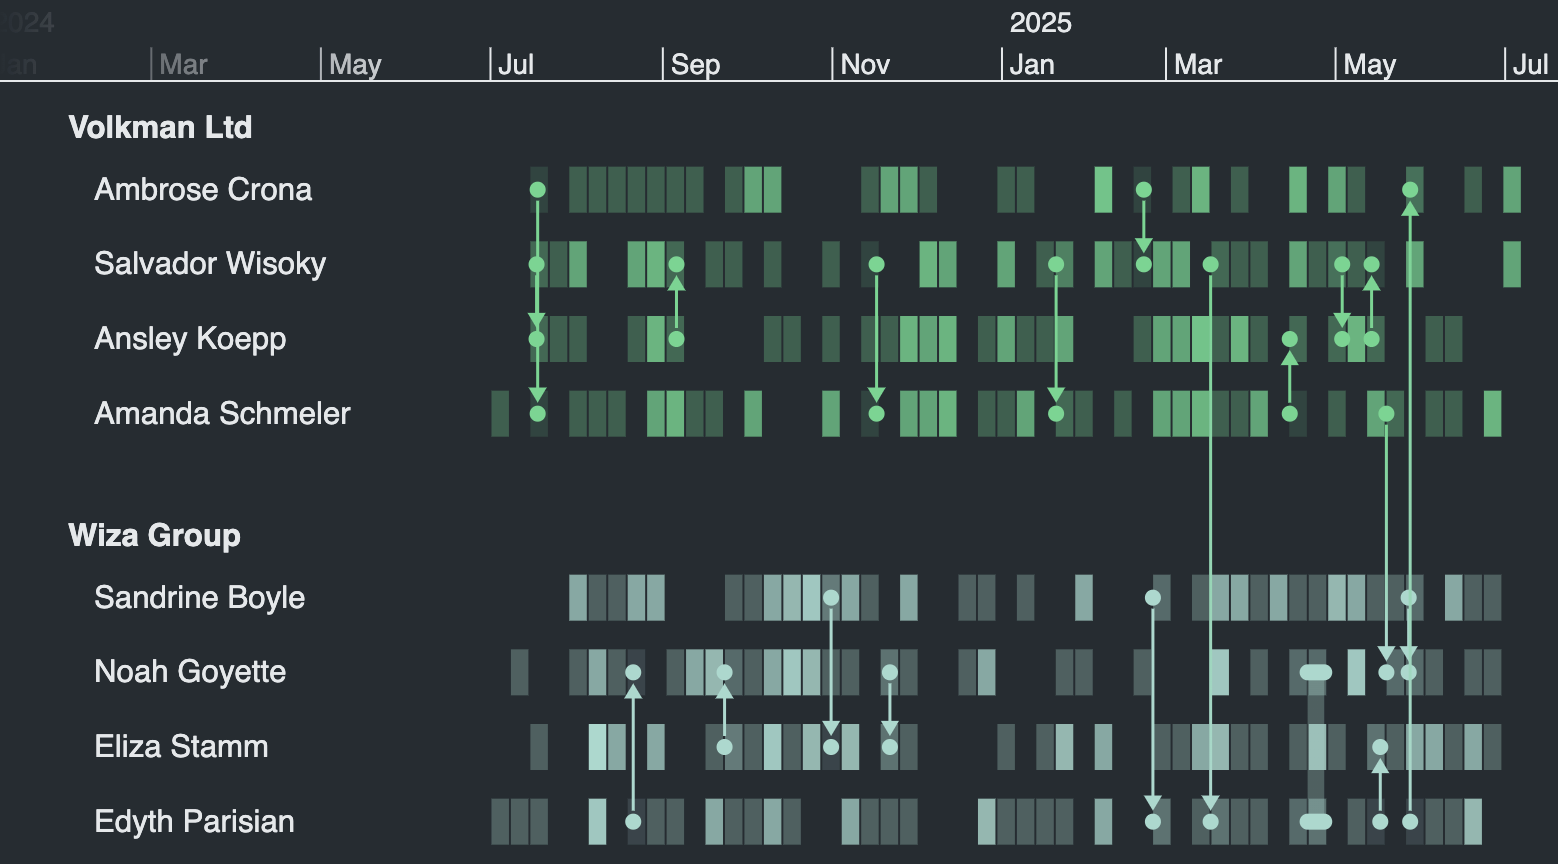
KronoGraph now offers event selection functionality with the new selection API. To use it, simply enable selectionMode.
KronoGraph now offers event selection functionality with the new selectionMode prop. To use it, simply enable selectionMode.
Combine annotations with event selection functionality to identify those interesting events and areas of the timeline. An example of how this might work is shown in the Creating Annotations example.
The new nonlinear scale mode compresses and expands time when there are dense clusters of events, large gaps between events, or you want to maximize timeline space for exported images. This can make it easier to see what's happening when the events in your timeline occur at irregular intervals.

Try it out by setting the scaleMode to 'nonlinear' to see the effects on your timeline. Find out how it works in the the Scale Mode docs or explore the benefits in the Crime Investigation demo or the Nonlinear Scale Mode example.
Ids must now be unique. If your time series charts share ids with an entity or event they must be renamed.These APIs were deprecated in the 2.4 release. Use Glyphs instead.
showCircles has been removed from the entities option. fontIcon has been removed from the entity data format.fontIcon has been removed from the entityType data format.This API was deprecated in the 2.0 release. It no longer had an effect, but now it will need to be removed from your code.
priority has been removed from the entityType data format.
scaleGuide to fit the existing design of your app. Try it out with
the new Scale Guide example or the
Email Analysis demo.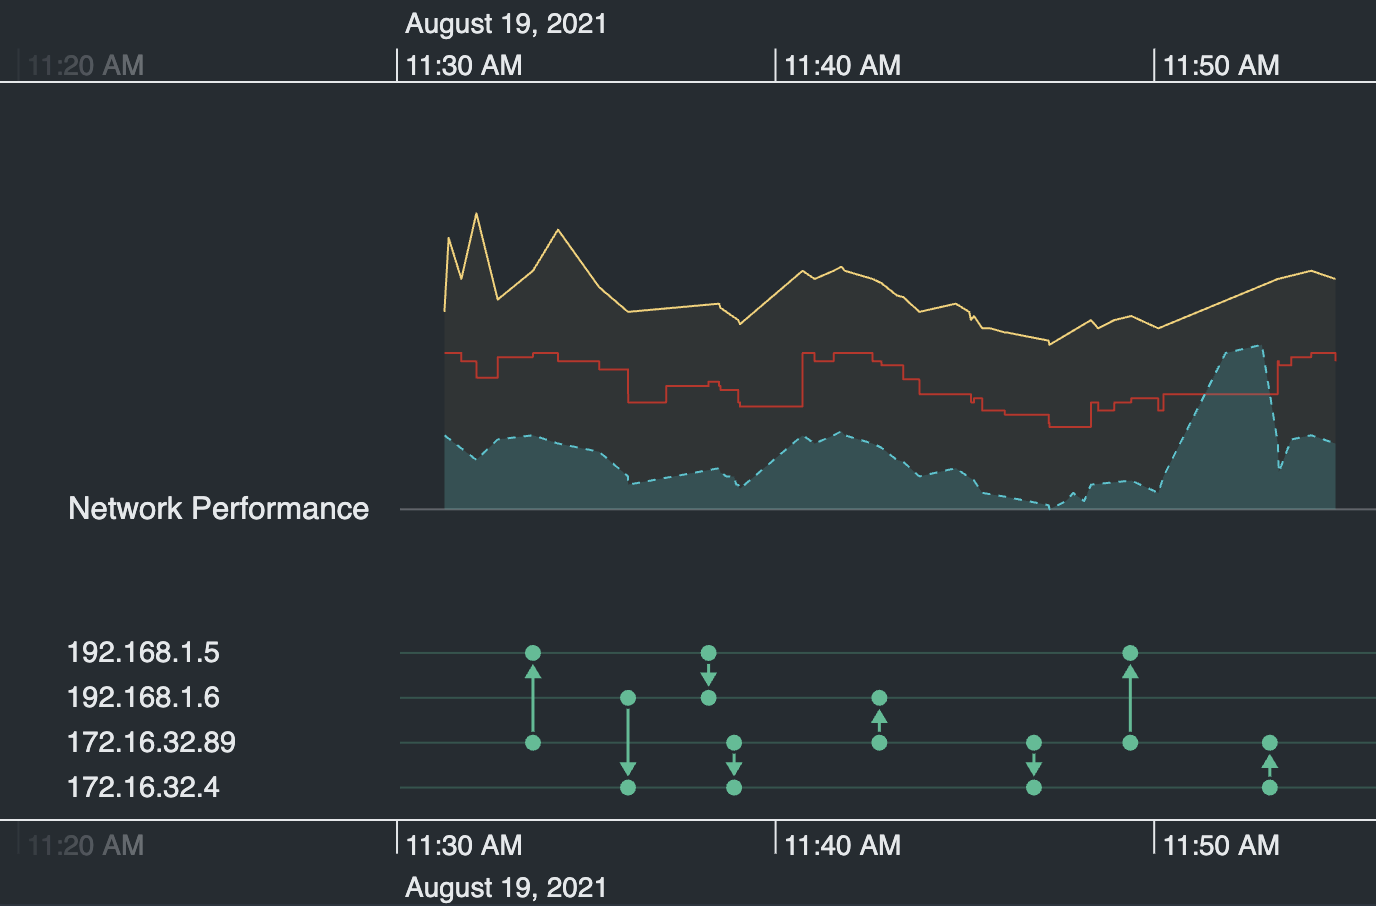

dragEnd event over a time series chart no longer causes an issue.showEventsOnNeighbors no longer causes an issue with the heatmap.
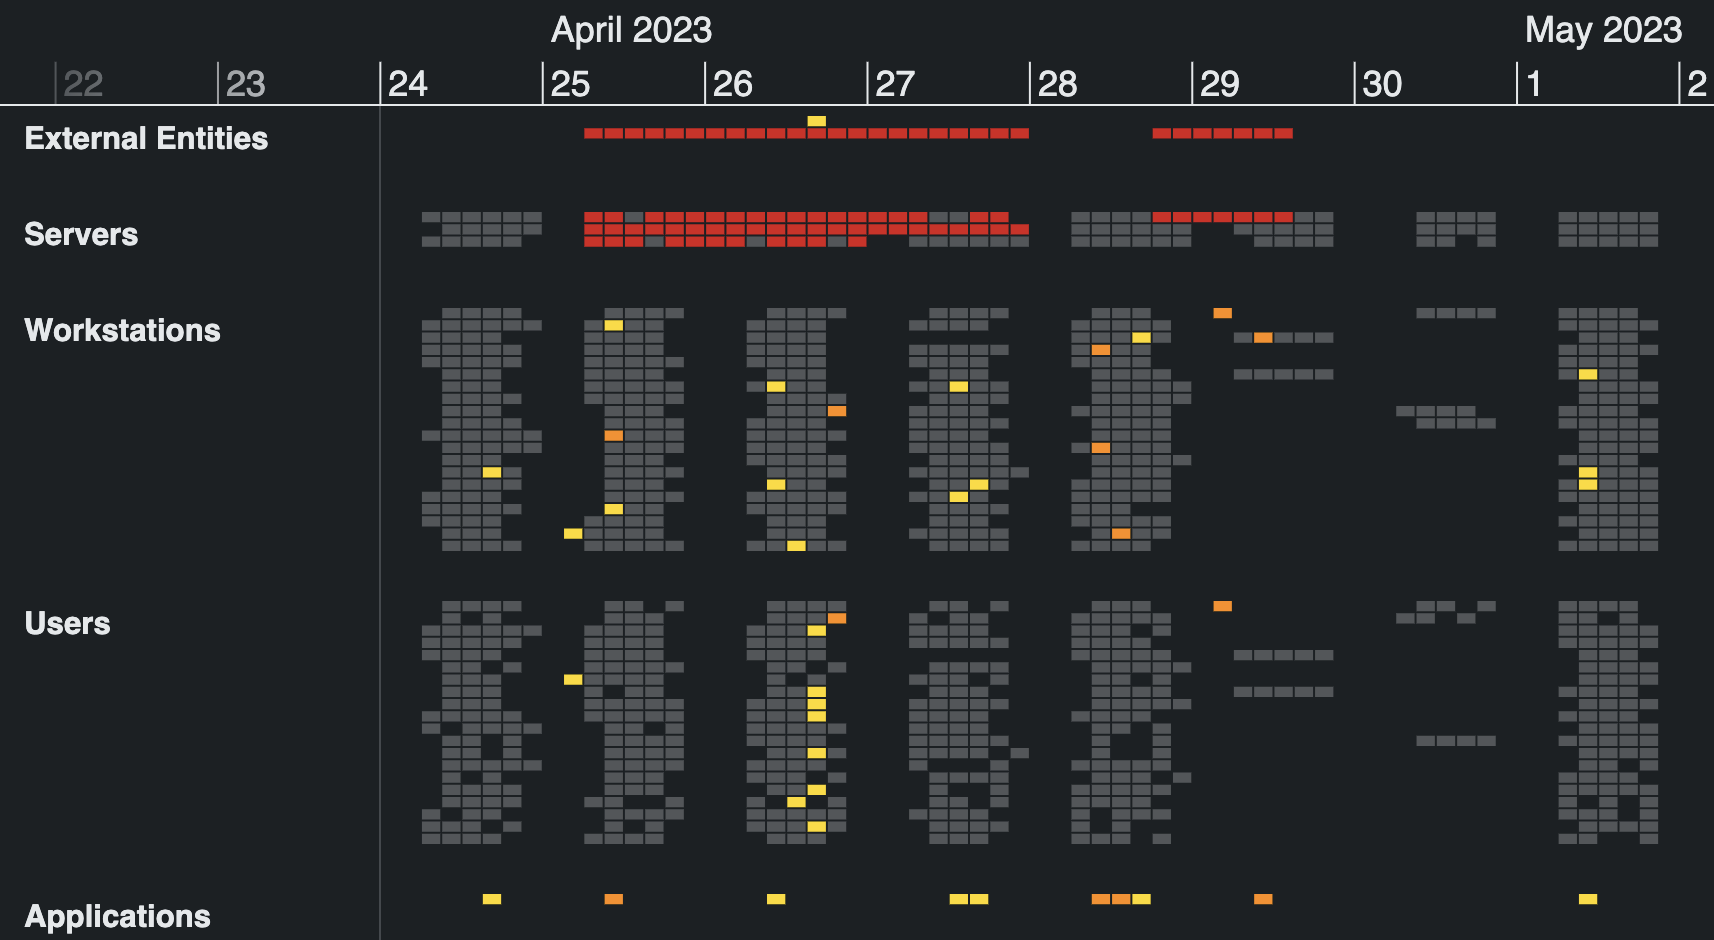
KronoGraph now shows event data for all entities in the timeline to give you an instant and tidy overview of your data. This allows you to identify areas of interest right away, and then take a closer look using the lens feature.
To open the lens, simply hover over the part of timeline that you want to investigate and click the  control.
The lens will keep the context of where you are in the data while enlarging a small section of it. You can
scroll to bring new data into view.
control.
The lens will keep the context of where you are in the data while enlarging a small section of it. You can
scroll to bring new data into view.
We're also giving you the option to control the lens through the lens API as either a getter or a setter.
We're also giving you the option to control the lens through the lens prop as either a getter or a setter.
We're providing some new TargetType options. You can use 'lensControl' and 'lensScrollbar' to determine how
your users are interacting with the lens and add customizations. We have a new dragType,
called 'lensScrollbar', which is returned when the scrollbar is used.
Try it out with the Lens example or Terror demo.
See our Migration Guide for help updating your app.
Glyphs can be used as a visual marker for your entities, like in our Fraud demo. Or add them to groups to clearly associate entity rows with their group labels, see our Terror demo for an example. Add them to your data using Entity.glyph and EntityType.typeGlyph. There's more to come here so look out for updates in later releases.
The size of the heatmap cells are now calculated in a way that shows more detail for large datasets. We're also quantifying the alpha values in a way that gives greater differentiation between cells.
label property returned for pointer events.targetType to check if your pointer is over the focus or pin controls.targetType to check if your pointer is over the focus or pin controls.priority. It remains part of entityType, but no longer has an effect.expand eventexpandedRowIdexpand option of controlstargetType values: 'collapse', 'expand', 'entityGroupMore', 'entityGroupRun'TimelineData and TimelineDataProps have been renamed to id.type property for time series charts offers two ways of connecting data points - 'linear' and 'step'.
The 'step' option is especially useful to display immediate changes in certain datasets such as account balances.
The Time Series Charts example shows both options.fontFamily for your application. See how it works in
the Styling the Timeline example.
targetType of 'timeSeriesChart' instead of null. joinStyle option lets you decide how to show links between exactly two entities. See our Multiple Recipients example.startTime and endTime properties in event handler objects
are now undefined instead of null. This makes them consistent with
the time property. If your code currently checks for null, update it to
use undefined instead.labelColor of an entity appeared with the wrong alpha value.showCircles option to control whether the circles at the start of the entity lines are displayed.targetType 'eventSummary' is passed to the
event handler and the eventIds property contains the ids of summarized events.
See the improved behavior throughout our showcase demos.heatmapLowerThreshold and heatmapUpperThreshold have been replaced with
a single heatmapThreshold
option.from and to properties to entityIds.
If you specify them, you'll see the ins and outs reflected in the event direction in relation to each entity,
just like in our new Multiple Sources example.color has also been improved.
For example, this results in smarter color gradients of non-directional events.
entityIds property.Once the marquee range is finished, the timeline zooms into the created range.
setDragOptions() function that lets you customize
the type of drag when the event is fired.
See how to create custom draggers for various user interactions in our brand new
Custom Dragging example.We're thrilled to announce the first General Availability release of KronoGraph. Version 1.0 has a stable API that’s been validated and guided by over 100 developers who took part in our Early Access program. Thank you for all your contributions!
See the Breaking Changes section for more details on the new API.
We've made some big improvements to the way groups look and behave. For example, the interactive group labels let you perform actions on a group as a whole, such as focusing or expanding an entire group. And thanks to our innovative 'runs' approach, any group can now be opened, no matter how big. See the improved groups in our Grouping examples and our Showcase demos.
Exploring the timeline is now easier with even more UI controls. You can expand or focus groups, focus entities or pin them to make sure they're always in the view. These controls can also be hidden or called programmatically, letting you create your own UI that suits your design.
You can now add or remove data or change the properties
of existing events and entities simply by using the set() function.
When set() is called, KronoGraph detects the changes to your
data and adjusts the timeline accordingly, minimizing unnecessary
movement and preserving any unchanged states.
This means that you can manage all changes to your data in your own
application state, without having to worry about the right way
to synchronize it with KronoGraph. See the new
Add/Remove Data
and Undo/Redo
examples.
When you make state changes, such as adding or removing items, or changing the styling of one or more item, KronoGraph will no longer reset the range, focus, or other internal state unless you've explicitly made that change yourself. See the new Change Event and Undo/Redo examples.
We've improved event handling and added more events you can respond to in your event handlers. We've also made zooming on the timeline more precise, added the possibility to configure a hover delay and added support for some touch gestures such as pinch-to-zoom or a long press. To find out more about events and how to respond to them, take a look at our new Events and Context Menu examples.
We've significantly improved validation for a better user experience. The error messages returned by KronoGraph when validation fails are now more detailed and useful for debugging.
For any help implementing the changes below, please contact support.
data
object passed to timeline.set
are now dictionaries indexed by the item id rather than arrays.
See the new data structure in the
Simple Events example.
id properties of both
entity
and event have been removed.
setFilter() function has been removed.
To filter out data, remove it from your data object and call timeline.set().
See the Filtering example.
groupingProperties property of EntityType has been renamed to groupBy.type and/or groupBy properties of open groups are now always shown in the form of a new row.showPinOnHover function has been removed.
Use the controls API instead.
targetType
instead of retuning null.id and targetType instead of returning 'undefined'.id of a single entity row is now the id of the entity itself
rather than an id of a group containing a single entity.preventDefault() property instead of returning true from the event handler.dx and dy attributes of a fontIcon
are now expressed as percentages of a font icon's size rather than as absolute offsets.value property of event
has been removed. Use the event's data property to store custom values on an event.
id property of ComponentDefinition
has been removed. The canvas id is now set internally.contextmenu event which fires when the user right clicks on the timeline. On touch devices this is triggered when the user long presses on the timeline.onTimelineContextmenu event which fires when the user right clicks on the timeline. On touch devices this is triggered when the user long presses on the timeline.fitToView() has been renamed to fit(). To set the timeline range to include all events, use fit().The Cambridge Intelligence Figma Design Kit is a powerful new tool to accelerate the design and build of beautiful, branded graph and timeline visualizations that seamlessly fit into your application UI. It aligns with our product feature sets and APIs, ensuring a faster and smoother Design-to-Development handover.
To use the Figma Design Kit, download it, and then either drag the .fig file, or import it, into your Figma project(s).
We always recommend using the most recent version of KronoGraph, as it includes the latest features, enhancements and performance optimizations. Every release is stable and suitable for production use. We understand that you might not be able to do this right away, especially if it means upgrading to a new major version.
If you'd prefer to continue using a previous major version, you can download a KronoGraph Long Term Availability (LTA) release.
With each major release we will make an LTA release of the previous minor release available. We'll always provide at least 12 months notice when we intend to remove an older LTA version.
If you're using an LTA release, you'll get the same high level of support from KronoGraph developers. We can't retrofit bug fixes in an LTA release, but if you find an issue, please report it to [email protected].