Choose your framework
JS
Documentation for plain JavaScript projects
React
Documentation for React projects
KronoGraph is a JavaScript library for building time-based visualizations.
To see how KronoGraph works with KeyLines and ReGraph , explore the Integration Playground.
If you need help with converting your data into the correct KronoGraph format, see the Handling Data section.
If you would like an introduction to the basic principles of building a timeline and get up-and-running with KronoGraph, follow this guide. We are going to embed a simple timeline in an HTML pagea React application, before adding data and attaching an event handler.
For the ReactJavaScript version of this guide, use the toggle in the top left corner.
To help accelerate the design and build of branded timeline visualizations that fit seamlessly into your application UI, download our free Figma Design Kit.
First we need to create an app to add a Timeline component to.
If you don't have an existing project, you can easily create one
with Vite using your preferred package.
npm create vite@latest my-kronograph-app -- --template vanilla
npm create vite@latest my-kronograph-app -- --template react
Once this process has completed, you can start your app:
cd my-kronograph-app
npm install
npm run dev
By default, Vite runs a development server at http://localhost:5173 .
Now that you have an app, download the latest version of KronoGraph:
For Safari browsers,
hold the ⌥ Option key when pressing the Download button
to download the correct .tgz format.
Open a new terminal window and access your project's root folder, which contains the app you just created:
cd my-kronograph-app
Next move the download into this folder. Do not change the file name. If you are on a UNIX-like operating system you can move the download from the terminal:
mv ~/Downloads/ .
From your project's root folder, install the bundle as a local package:
npm install file:
It's time to add a timeline to the app.
First we need to add an element to the HTML page
so that KronoGraph can attach a Timeline to it. We then
call createTimeline(), passing the id of the parent element to it.
Let's load the files into the page and create a div for the
Timeline. Add the following to index.html:
<!DOCTYPE html>
<html lang="en">
  <head>
    <meta charset="UTF-8" />
    <title>Hello, world!</title>
    <link rel="stylesheet" href="/src/style.css" />
    <script type="module" src="/src/main.js"></script>
    <!--if you are using TypeScript, delete the line above and then uncomment the line below-->
    <!--<script type="module" src="main.ts">-->
  </head>
  <body>
    <div id="my-timeline" class="timeline"></div>
  </body>
</html>
Next we import createTimeline into the page,
create a Timeline element in main.js,
and add some data:
// main.jsimport { createTimeline } from 'kronograph'; const timeline = createTimeline('my-timeline'); const data = { entities: { 'Person 1': {}, 'Person 2': {} }, events: { 'Phone call 1': { entityIds: ['Person 1', 'Person 2'], time: new Date(2020, 6, 1, 12, 0), }, 'Phone call 2': { entityIds: ['Person 1', 'Person 2'], time: new Date(2020, 6, 1, 13, 0), }, 'Phone call 3': { entityIds: ['Person 2', 'Person 1'], time: new Date(2020, 6, 1, 14, 0), }, }, }; timeline.set(data); timeline.fit();
And define some styling in style.css:
/* style.css */
.timeline {
  height: 100vh;
  width: 100vw;
}

body {
  margin: 0;
}
This guide assumes that your component is declared in App.jsx.
You can also use a separate file but you will need to make sure
your architecture includes it in the app.
To create a timeline, we need to import the Timeline
component into the app and then pass some data into the
Timeline component's props.
Replace the contents of App.jsx with:
// App.jsximport React from 'react';
import Timeline from 'kronograph/react/Timeline';

const data = {
  entities: { 'Person 1': {} , 'Person 2': {} },
  events: {
    'Phone call 1': {
      entityIds: ['Person 1', 'Person 2'],
      time: new Date(2020, 6, 1, 12, 0),
    },
    'Phone call 2': {
      entityIds: ['Person 1', 'Person 2'],
      time: new Date(2020, 6, 1, 13, 0),
    },
    'Phone call 3': {
      entityIds: ['Person 2', 'Person 1'],
      time: new Date(2020, 6, 1, 14, 0),
    },
  },
};

function App() {
  return (
    <div style={{ height: '100vh', width: '100vw' }}>
      <Timeline entities={data.entities} events={data.events} />
    </div>
  );
}

export default App;
The timeline sets its height and width to equal the size of its parent element, so any styles should be set on the parent.
Your timeline should now look like this:
KronoGraph has a few useful default functions to let users navigate the timeline. You can add your own custom behavior to user interactions by attaching a custom handler:
To define a custom handler, add a new handler function
after your data in main.js:
// main.jsfunction clickHandler(event) {
  window.alert(`You clicked a timeline item of type '${event.targetType}'`);
}
And then attach it to the Timeline by adding
this after createTimeline():
// main.jstimeline.on('click', clickHandler);
To define a custom handler, add a new handler to the
App() function in App.jsx:
// App.jsxconst clickHandler = event => {
  window.alert(`You clicked a timeline item of type '${event.targetType}'`);
}
And now pass it to the onClick prop:
// App.jsx<Timeline
  entities={data.entities}
  events={data.events}
  onTimelineClick={clickHandler}
/>
Your app should now look like the one below. Try clicking on entities and events on the timeline to see their type in a browser alert.
Congratulations! You have created your first KronoGraph app. Here are some ideas what to do next:
Model Context Protocol (MCP) is an open-source standard to expose tools, data, or functionality to AI applications.
KronoGraph MCP server enables AI agents in your code editor to access our APIs and docs and provides more accurate and relevant help when developing with KronoGraph.
All Cambridge Intelligence products have MCP servers. You can use them individually or together when integrating multiple products from our suite.
MCP servers are compatible with different code editors thanks to the universal open-source standard. Generally, code editors have an MCP configuration file, often named mcp.json. Every MCP server is added to this config file as a new entry:
{
  "servers": {
      "kronograph": {   // our KronoGraph MCP server
          "url": "https://mcp.cambridge-intelligence.com/kronograph",
          "type": "http"
      },
      "mapweave": {   // our MapWeave MCP server
          "url": "https://mcp.cambridge-intelligence.com/mapweave",
          "type": "http"
      },
      / ... /
  }
}
This section shows how to add MCP servers to selected code editors. If your code editor isn't here, check the official documentation for the exact location of the MCP config file.
First, install Claude Code globally in your environment:
npm install -g @anthropic-ai/claude-code
Next, add a new MCP server to Claude and name it:
claude mcp add --transport http my-kronograph-mcp-server https://mcp.cambridge-intelligence.com/kronograph
Finally, verify that the server is running:
claude mcp list
For details and troubleshooting, see Connect Claude Code to tools via MCP.
Create a config file .cursor/mcp.json in your project's root folder and add the MCP server:
{
  "mcpServers": {
      "kronograph": {
          "command": "npx",
          "args": ["-y", "mcp-remote@latest", "https://mcp.cambridge-intelligence.com/kronograph"]
      }
  }
}
"npx": Runs the server using npx tool by Node.js "-y": Confirms the installation"mcp-remote@latest", "https://mcp.cambridge-intelligence.com/kronograph": Downloads the packageThis method downloads the MCP server as a package using mcp-remote because Cursor currently doesn't consistently support streamable http connections.
To verify the server is running, press Shift+Command+U (Mac) / Ctrl+Shift+U (Win) to open the Output panel. Select MCP Logs from the drop-down menu to view logs confirming that the server is connected.
For details and troubleshooting, see the Model Context Protocol (MCP) docs by Cursor.
To add an MCP server to JetBrains IDEs such as IntelliJ IDEA or WebStorm, use the latest version of the IDE and install the JetBrains AI Assistant plugin.
{
  "mcpServers": {
      "kronograph": {
          "url": "https://mcp.cambridge-intelligence.com/kronograph",
          "type": "http"
      }
  }
}
To verify the server is running, go to Help | Show Log in Explorer/Finder/Nautilus (depending on OS). The directory contains an mcp folder with a separate log file for each added MCP server.
For details and troubleshooting, see the Model Context Protocol (MCP) docs by JetBrains.
Make sure you are on the latest version of VS Code and have access to GitHub Copilot.
https://mcp.cambridge-intelligence.com/kronograph
my-kronograph-mcp-server
This creates an mcp.json file in the .vscode directory with the MCP server specified.
To verify the server is running, click the Extensions icon in the left navigation panel and find the MCP SERVERS - INSTALLED tab. Right-click on the server listed in this tab and select Show Output to view logs confirming that the server is connected.
For details and troubleshooting, see the Use MCP servers in VS Code docs by VS Code.
To help you get started, here are some example prompts to use for the MCP servers:
We collect a short list of key words from your prompts and the answers provided by the MCP server, and we analyze this data so we can continue improving our MCP server for a better developer experience. The format may look like this:
"query": "export timeline to PNG image"
KronoGraph can be integrated with other Cambridge Intelligence products, such as KeyLines ReGraph and MapWeave , to show timeline visualizations of your data alongside a chart or map visualization. You can configure your application so that when the data updates, or a user interaction changes the timeline, the changes are reflected in the other product and vice versa.
See the Integration Playground or the Integrations section of our Storybook for examples.
In this section we refer to KronoGraph timelines and entities, KeyLines ReGraph charts and nodes, and MapWeave maps and nodes.
There's no one standard way to integrate KronoGraph with another of our products as it depends on your data model and the interactions you want to offer your end users. It's worth considering:
The following sections illustrate the most common interaction patterns to get you started:
We provide a set of stories to illustrate how to do this with each of our products, and an Integration Playground
Integrate KronoGraph with KeyLines ReGraph to show both timeline and chart visualizations of your data together.
Keep the chart synchronized with the time range shown in the timeline. As the user pans or zooms the timeline, the chart should then only show connections that are present during the displayed time range.
When the timeline range changes, handle it:
timeline.on('range', timelineRangeHandler);
onTimelineChange={timelineChangeHandler}
Create a function to identify the entities currently visible in the timeline, and then display just their corresponding nodes in the chart. The
isEmpty function,
pickBy function,
used here, is provided by the lodash library.
async function timelineRangeHandler() {
  const { entities: visibleEntityIds } = timeline.getInRangeItems({ focus: false });
  const filterOptions = { type: 'node', animate: false };
  const { shown, hidden } = await chart.filter(item => visibleEntityIds[item.id], filterOptions);
    if (!isEmpty(shown.nodes) || !isEmpty(hidden.nodes)) {
      await chart.layout('organic');
    }
};
function timelineChangeHandler() {
  const { entities, events } = timeline.current.getInRangeItems({ focus: false });
  setChartItems(pickBy(chartData, (_item, id) => events[id] || entities[id]));
};
This use of range and getInRangeItems is illustrated in the KeyLines and ReGraph Integration Basics story.
This use of range and getInRangeItems is illustrated in the KeyLines and ReGraph Integration Basics story.
The KronoGraph focus API focus API filters the timeline so that only focused items and their connections are shown. This example shows how to use this to select the corresponding items in the chart.
In this example chart nodes have the same ids as their corresponding timeline entities.
When an entity is focused in the timeline, handle it:
timeline.on('focus', ({ focus }) => applySelection(focus));
onTimelineChange={timelineChangeHandler}
Create a function that passes the focused items to chart selection:
async function applySelection(selection) {
  chart.selection(selection);
};
function timelineChangeHandler({ focus }) {
  if (focus){
    setFocusedItems(Object.fromEntries(focus.map(id => [id, true])));
  }
}
This use of focus focus is illustrated in the KeyLines and ReGraph Integration Basics story, which also illustrates how using focus compares to using entitySelection. entitySelection.
You could adapt this further by setting eventSelectionMode, eventSelectionMode, and using the eventSelection API eventSelection prop to highlight links in the chart.
The example below shows how to display the timelines associated with items selected in the chart.
In this example chart nodes have the same ids as their corresponding timeline entities.
When an item is selected in the chart, handle it:
chart.on('selection-change', () => applySelection(chart.selection()));
onChange={chartChangeHandler}
Create a function that passes the selected items to the timeline, and sets their focus:
async function applySelection(selection) {
  const selectedNodeIds = selection.filter(itemId => chart.getItem(itemId).type === 'node');
  timeline.focus(selectedNodeIds);
};
function chartChangeHandler({ selection }) {
  if (selection) {
    setFocusedItems(selection);
  }
}
This use of focus focus is illustrated in the KeyLines and ReGraph Integration Basics story, which also illustrates how using focus compares to using entitySelection. entitySelection.
Integrate KronoGraph with MapWeave to conduct in-depth temporal analysis on your geospatial data. You can use the visible timeline range to filter data, or set the focus on entities to filter and zoom on specific nodes and their journeys on the map. You can also use KronoGraph features such as the Ping API Ping API to highlight the item on the timeline, which can be useful for busy datasets.
Keep the information displayed in MapWeave synchronized with the timeline's time range. As the user pans or zooms the timeline, the map should then only show nodes involved with events displayed in the time range.
When the timeline range changes, handle it:
timeline.on('range', timeRangeChangeHandler);
onTimelineChange={timelineChangeHandler}
Create a function to identify the entities currently visible in the timeline, and then display just their corresponding nodes in the map:
function timeRangeChangeHandler( range ) {
  networkLayer.options({ timeFilterRange: range });
}
function timelineChangeHandler({ range }) {

  setNetworkLayerOptions(options => {
    return { ...options, timeFilterRange: range };
  });
}
This use of range range is illustrated in the MapWeave Integration Basics story.
The KronoGraph focus API focus API filters the timeline so that only focused items and their connections are shown. The example below shows how to use this to select the corresponding nodes in the map.
In this example the MapWeave nodes have the same ids as their corresponding timeline entities.
Get the items which have focus in the timeline:
timeline.on('focus', focusHandler);
onTimelineChange={timelineChangeHandler}
Create a function that passes them to MapWeave and displays just these focused items:
function focusHandler(event) {
  const focusedNode  = event.focus[0];
  const neighbours = graphEng.neighbors(focusedNode );
  const neighbourNodes = neighbours.nodeIds;

  networkLayer.options({
    foreground: { ids: [
      ...neighbourNodes.concat(neighbours.linkIds),
      focusedNode ]},
  });
}
function timelineChangeHandler({ focus }) {
  if (focus) {
      const focusedNode = focus[0];
      const neighbours = graphEngine.neighbors(focusedNode);
      const neighbourNodes = neighbours.nodeIds;

      setNetworkLayerOptions(options => {
        return {
          ...options,
          foreground:
          { ids: [
            ...neighbourNodes.concat(neighbours.linkIds),
            focusedNode, ]},
        };
      });
  }}
This use of focus focus is illustrated in the MapWeave Integration Basics story.
The example below shows how to display the timelines associated with a selected node.
In this example nodes on the map have the same ids as their corresponding timeline entities.
Catch each node that's clicked in the map:
mapweave.on('click', clickHandler);
onClick={clickHandler}
Create a function that shows just that node, and passes the selected item to the timeline, and displays it with focus set:
function clickHandler(click) {
  const clickedItem = click.item;
  if (clickedItem.type === 'node') {

    networkLayer.options({
      foreground: { ids: [
        click.id ],
        backgroundOpacity: 0 },
    });

    timeline.focus(click.id);
  }
}
function clickHandler(click) {
  const clickedItem = click.item;
  if (clickedItem.type === 'node') {

    setNetworkLayerOptions(options => {
      return {
        ...options,
        foreground: {
          ids: [ click.id ],
          backgroundOpacity: 0 },
      };
    });

    setFocus(click.id);
  }
}
This use of focus focus is illustrated in the MapWeave Integration Basics story.
To update the version of KronoGraph, or to update your license, you need to replace your existing kronograph.tgz bundle with the latest version and add it to your project.
First, download the latest KronoGraph bundle:
Safari users can
hold the ⌥ Option key when pressing the Download button
to download the correct .tgz format.
Open a new terminal window and access your project's root folder.
From there, move the download into your project's root folder. Do not change the file name. If you are on a UNIX-like operating system you can move the download from the terminal:
mv ~/Downloads/ .
If you already have a bundle in your project, you should remove it now.
Finally, remove the old version and install the bundle again from inside your project's root folder using your package manager:
npm uninstall kronograph
npm install file:
To verify the upgrade was successful, you can either ask your package manager which version was installed:
npm list kronograph
Or consult the header comments in node_modules/kronograph/kronograph.js.
If you can't see the correct version installed or if the chart isn't displaying correctly, try clearing the package manager's cache and installing the package again:
npm cache clean --force
npm install file:
If you need any help with updating please contact support.
KronoGraph is a JavaScript library that lets you
add Timeline components to your web applications.
These components show the timelines of entities and the events that involve them,
creating time-based data visualizations.
Select an option from the drop-down list to see interactive examples of items such as entities, events, annotations, lens view, markers, time series charts and more:
KronoGraph allows you to interact with your entities and their timelines in different ways to explore your data.
Select an option from the drop-down list to see examples of interactions such as navigating the timeline, changing the time scale, selecting events or entities, and using lens view, event folds, pins, focus and more:
| Show: |
Note that entities are automatically arranged more compactly as you zoom out. If you zoom out far enough, labels are no longer shown. The lens control
 on the left allows you to toggle lens view and see the labels.
KronoGraph allows you to set up the timeline in many different ways so you can change its look, feel and behavior to suit your requirements and data.
Most timeline settings can be found in TimelineOptions. Pass them to the options method options prop to make the changes.
The timeline below uses the default settings. Select an option from the drop-down box to see the effect of changing the background color, entity label colors, focus control display, fonts, highlight colors, scale positions, annotations settings and more:
| Show: |
When the
lens control is shown, because there's not enough vertical space to show entity labels, the entities to be magnified in lens view
are, by default, highlighted.
To disable the highlight, as illustrated here, use the showLensHighlight option:
timeline.options({ showLensHighlight: false });
 <Timeline
    options={{
      showLensHighlight: false,
    }}
  />
See the Lens story for more information.
Usually an entity's timeline is displayed using a single row. If entities have duration events overlapping with instantaneous ones, or events that are close together, it can be helpful to add extra sub-rows to display them more clearly (if there's room).
You can set entity rows to expand using the expandedRows API so that users can zoom in on busy areas and see individual events more clearly, as illustrated:
You can set entity rows to expand using the expandedRows method so that users can zoom in on busy areas and see individual events more clearly, as illustrated:
| Show: |
Refine how entity rows are expanded using:
To explore further, take a look at the Expanded Rows story.
By default, KronoGraph adjusts the width of the entity label area automatically to best display the labels in your data. Alternatively, you can set the label area width to a custom value and allow the user to adjust the area width by dragging. See the below example:
timeline.labelAreaWidth('fixed', 200);
<Timeline
   labelAreaWidth={{mode: 'fixed', width: 200}}
/>
The width is set in pixels, and can be anywhere between 125px and 80% of the width of the timeline. Any value outside of these limits will be automatically adjusted to be within the limits.
For further details see the labelAreaWidth() API and the Styling the Timeline story.
For further details see the labelAreaWidth() API and the Styling the Timeline story.
Entities run horizontally on the timeline and are shown when they have an associated event in the visible time range.
Customize and style your entities with the properties in the Entity object. Here the first entity has all the default properties and the second entity has some custom properties set:
 const entities = {
  'Default Entity Style': {},
  'Custom Entity Style': {
    color: '#c9477b',
    lineWidth: 5,
    labelColor: '#ffd88f',
    glyph: true,
    fadeOutsideRange: true,
  },
},
Try out some of the properties in the Styling Entities story.
If you have a number of entities that you want to customize in the same way, use the EntityType object and
then assign a type to the Entity. Each entity can only have one type.
In these examples, we are using a subset of the "Bigfoot Sightings" data from the Bigfoot Field Researchers Organization (BFRO) . Here, the numbered sightings are organized into types by State. Each State has its own EntityType where the entity color is set.
There is an assigned order for the California and Colorado entity types. The order property allows you to control the sequence of entity types on the timeline.
This is an example of how the entityTypes are shown in the data:
 const entityTypes = {
  "California": {
    "color": "#e9d8a6",
    "order": 1
  },
  "Connecticut": {
    "color": "#94d2bd"
  },
  "Colorado": {
    "color": "#EE9B00",
    "order": 0
  }
}
This is how the entityTypes are assigned to the entities using the type property:
 const entities = {
  "7211": {
    "type": "California"
  },
}
See types in use in the Styling Items by Type story.
Entity types can inherit properties from a baseType. In this example, each entity has a type based on its classification. "Class A" and "Class B" set the labelColor and the entity color is inherited from the "California" entity type.
const entities = {
  "7555": {
    "type": "Class A"
  }
}
const entityTypes = {
  "California": {
    "color": "#62b6cb",
  },
  "Class B": {
    "labelColor": "#f9c74f",
    "baseType": "California"
  },
  "Class A": {
    "labelColor": "#90be6d",
    "baseType": "California"
  },
  "Class C": {
    "baseType": "California"
  }
}
See the Inherited Styles story for more details.
It's possible to specify entity properties using the default entity type:
 const entityTypes = {
  default: {
    color: '#EE9B00',
    lineWidth: 5,
    labelColor: '#EE9B00',
  },
},
Any entity that doesn't have these properties set will inherit them from the default entity type.
Note the default type cannot have a baseType.
Further organize entities in the timeline using groupBy to create as many nested levels as needed. Here all the entities have the type as "State" and are grouped by "season" and "classification".
The groupBy property is set within the entityType:
const entityTypes = {
  "California": {
    "color": "#e9d8a6",
    "groupBy": [
      "season",
      "classification"
    ]
  },
}
The "season" and "classification" are set within the data object for each entity:
 const entities = {
  "14338": {
    "data": {
      "season": "Fall",
      "classification": "Class A"
    },
    "type": "California"
  },
}
For more details on groups, see the Groups story.
Glyphs are circles displayed alongside entity and entity type labels. They're especially useful for adding extra meaning to your labels or for highlighting certain entities or entity types. You can also style them with custom colors or font icons.
Use the following APIs to add glyphs to your timeline:
 const entityTypes: {
  Customer: {
    typeGlyph: {
      color: '#943651',
      fontIcon: {
        fontFamily: 'Font Awesome 5 Free',
        fontWeight: 100,
        text: '\u{f256}',
      },
    },
  },
  'Sales Person': {
    glyph: {
      color: '#FFCD00',
      fontIcon: {
        fontFamily: 'Font Awesome 5 Free',
        fontWeight: 900,
        text: '\u{f53a}',
      },
    },
  },
},
const entities: {
  'smith-johnathan-151': {
    label: 'John Smith',
    type: 'Customer',
    color: '#E32F42',
  },
  'west-josephine-126': {
    label: 'Josephine West',
    color: '#FF7A4F',
    glyph: true,
    type: 'Customer',
  },
  'roberts-nathaniel-023': {
    label: 'Nathan Roberts',
    color: '#00AFB9',
    type: 'Sales Person',
  },
  'baxter-eleanor-004': {
    label: 'Ella Baxter',
    color: '#0077B6',
    type: 'Sales Person',
  },
},
Glyphs inherit the color of the entity or entity type that they are applied to unless you assign a color via the Glyph object.
The position of glyphs in relation to the entity label or entity type label is controlled globally via the glyphPosition option.
For more ideas take a look at the Styling Glyphs story.
Events can be styled and customized using the properties in the Event object.
You can emphasize different aspects of events using color, and control the appearance of event lines using lineWidth and showArrows. The Styling Events story allows you to explore and experiment with these settings.
You can also (in beta), add labels to event lines, styling their color and orientation, as illustrated in the Event Labels story.
In the example above the color and lineWidth properties have been changed for "event2".
const events = {
  event1: {
    entityIds: ['entity1'],
    time: new Date(2025, 7, 14, 8, 56),
  },
  event2: {
    entityIds: ['entity2', 'entity1'],
    time: new Date(2025, 7, 14, 8, 56, 10),
    color: '#e07a5f',
    lineWidth: 5,
  },
}
If you have a number of events that you want to customize in the same way, use the EventType object and
then assign a type to the Event.
In these examples we are using a subset of the "Street Network Changes" from the City of New York . Here, the street change events are styled by the type of change. Each type of change has its own EventType where a color and fontIcon are added.
This is an example of how the EventTypes are shown in the data:
 const eventTypes = {
  "Two-way Conversion": {
    "color": "#227c9d",
    "fontIcon": {
      "fontFamily": "Font Awesome 5 Free",
      "fontWeight": 900,
      "text": "\uf101"
    }
  },
  "One-way Conversion": {
    "color": "#ffcb77",
    "fontIcon": {
      "fontFamily": "Font Awesome 5 Free",
      "fontWeight": 900,
      "text": "\uf138"
    }
  },
},
This how the EventTypes are assigned to the events using the type property:
 const events = {
  "172 Stchange": {
    "entityIds": [
      "93 Ave",
      "Jamaica Ave"
    ],
    "time": 1436223600000,
    "type": "One-way Conversion"
  }
}
Properties can be inherited using a baseType.
In this example each event's color is derived from its type. The
fontIcon is set on the baseType of each type.
 const eventTypes = {
  "Street Change": {
    "fontIcon": {
      "fontFamily": "Font Awesome 5 Free",
      "fontWeight": 900,
      "text": "\uf101"
    }
  },
  "Brooklyn": {
    "color": "#17c3b2",
    "baseType": "Street Change"
  },
  "The Bronx": {
    "color": "#227c9d",
    "baseType": "Street Change"
  },
  "Queens": {
    "color": "#ffcb77";
    "baseType": "Street Change"
  }
}
See the Inherited Styles story for more details.
Events that have unspecified properties will inherit them from the default type. Assign properties to the default event type as follows:
 const eventTypes = {
  default: {
    color: '#EE9B00',
  },
},
Note the default type cannot have a baseType.
When multiple events are drawn too closely to one another, KronoGraph will combine them into event summaries to prevent overlapping.
An event summary is displayed as a lozenge running along the entity row, using the color of the majority of the events it summarizes.
Event summaries are connected vertically using a translucent band reflecting the colors of the event summaries at either end.
When interacting with any of the parts of an event summary,
the targetType in the event handler is 'eventSummary'
and the eventIds property contains the ids of all summarized events:
function clickHandler ({ targetType, eventIds }) {
// the user clicked an event or event summary
  if (targetType === 'event' || targetType === 'eventSummary') {
    console.log(`Event ids: `, eventIds);
  }
}
timeline.on('click', clickHandler);
const handleClick = ({ targetType, eventIds }) => {
// the user clicked an event or event summary
  if (targetType === 'event' || targetType === 'eventSummary') {
    console.log(`Event ids: `, eventIds);
  }
}
<Timeline
entities={entities}
events={events}
onTimelineClick={handleClick}
/>
When more than one event happens at the same time, KronoGraph allows you to inspect those events more closely in an event fold.
Because the events happen simultaneously, we imagine they are folded behind the timeline. To "unfold" them, event folds can be clicked and opened which brings the individual events into view.
The event folds are only visible once the timeline is sufficiently zoomed in so that any event summary they're part of has been resolved to single event times. Only one event fold can be open at a time.
All events within the fold have the same time stamp, shown by where the fold is attached to the scale.
The time is accessible via the Event object, so a tooltip can be added if needed.
Event folds are shown by default. You can hide them using the showEventFolds API.
When interacting with the fold, the targetType in the event handler is
'fold' and the eventIds property contains the ids of the events within the fold.
function clickHandler ({ targetType, eventIds }) {
// the user clicked a fold
  if (targetType === 'fold') {
    console.log(`Events List: `, eventIds);
  }
}
timeline.on('click', clickHandler);
const handleClick = ({ targetType, eventIds }) => { // the user clicked a fold if (targetType === 'fold') { console.log(`Events List: `, eventIds); } } <Timeline entities={entities} events={events} onTimelineClick={handleClick} />
Take a peek at our Event Folds story for a working example.
Time series charts are used to visualize continuous time series data over a recorded period.
You can add one or more time series charts to the timeline. Time series charts share the timeline's scale, aligning the data points with the events displayed in the timeline. This lets you identify interesting points or patterns in the data and investigate the particular events that may be related to them.
This example uses a sample of the Gridwatch dataset, which tracks the sources of energy production in the UK.
To add time series charts to your timeline, pass them in the timeSeriesCharts data object:
To add time series charts to your timeline, pass them in the timeSeriesCharts prop:
const data = {
  events : {},
  entities: {},
  timeSeriesCharts: {
    nuclear: {
      color: "#f48c06",
      data: [
        // ... //
      ]
    },
    gas: {
      color: "#b8d0eb",
      data: [
        // ... //
      ]
    },
    wind: {
      color: "#c77dff",
      data: [
        // ... //
      ]
    },
    hydro: {
      color: "#00b4d8",
      data: [
        // ... //
      ]
    },
    solar: {
      color: "#ffcc00",
      data: [
        // ... //
      ]
    },
  }},
<Timeline
events={events}
entities={entities}
timeSeriesCharts={
  nuclear: {
    color: "#f48c06",
    data: [
      // ... //
    ]
  },
  gas: {
    color: "#b8d0eb",
    data: [
      // ... //
    ]
  },
  wind: {
    color: "#c77dff",
    data: [...
    ]
  },
  hydro: {
    color: "#00b4d8",
    data: [
      // ... //
    ]
  },
  solar: {
    color: "#ffcc00",
    data: [
      // ... //
    ]
  },
}
/>;
Set the size and position of the timeline in the timeSeriesCharts options:
timeline.options({
  timeSeriesCharts: {
    sizePercent: 100,
    position: 'bottom',
  },
});
options={{
  timeSeriesCharts: {
    sizePercent: 100,
    position: 'bottom'
  },
}}
Note that if scale wrapping is applied or the scale mode is set to 'nonlinear', time series charts will be hidden.
Time series charts can be styled and customized using the properties in the TimeSeriesChart Object.
 const timeSeriesCharts = {
  'Default Chart Style': {
    data: [
      // ... //
    ],
  },
  'Custom Chart Style': {
    data: [
      // ... //
    ],
    color: '#c9477b',
    labelColor: '#ffd88f',
    fillAreaAlpha: 0.5,
    lineStyle: 'dashed',
  },
},
Take a look at how the styles can be applied in the Time Series Charts story.
If you have more than one time series dataset, the charts can be added to a time series chart stack. This allows you to compare two related time series datasets or save space on the timeline. In this example, the energy types are grouped into 'Renewable' and 'Non-Renewable'.
To stack your time series charts add the timeSeriesChartStack
object to your timeline data. Include the chartIds you want to see in each stack.
 const data = {
  events: {},
  entities: {},
  timeSeriesChartStacks: {
    Renewable: {
      chartIds: [
        "wind",
        "hydro",
        "solar"
      ]
    },
    Non-Renewable: {
      chartIds: [
        "nuclear",
        "gas"
      ]
    }
  },
  timeSeriesCharts: {
    nuclear: {
      color: "#f48c06",
      data: [
        // ... //
      ]
    },
    gas: {
      color: "#b8d0eb",
      data: [
        // ... //
      ]
    },
    wind: {
      color: "#c77dff",
      data: [
        // ... //
      ]
    },
    hydro: {
      color: "#00b4d8",
      data: [
        // ... //
      ]
    },
    solar: {
      color: "#ffcc00",
      data: [
        // ... //
      ]
    },
  },
}
<Timeline
events={events}
entities={entities}
timeSeriesChartStacks={
  Renewable: {
      chartIds: [
        "wind",
        "hydro",
        "solar"
      ]
    },
    Non-Renewable: {
      chartIds: [
        "nuclear",
        "gas"
      ]
    }
}
timeSeriesCharts={
  nuclear: {
    color: "#f48c06",
    data: [
      // ... //
    ]
  },
  gas: {
    color: "#b8d0eb",
    data: [
      // ... //
    ]
  },
  wind: {
    color: "#c77dff",
    data: [
      // ... //
    ]
  },
  hydro: {
    color: "#00b4d8",
    data: [
      // ... //
    ]
  },
  solar: {
    color: "#ffcc00",
    data: [
      // ... //
    ]
  },
},
}
/>;
When charts are stacked only the label of the stack is shown. The labels for the individual charts are not shown.
The properties of time series chart data points are available via the subItem object.
When the targetType is 'timeSeriesChart', the subItem object will be returned
with the values for that data point.
timeline.on('click', (pointerEvent) => {
  if (pointerEvent.targetType === 'timeSeriesChart') {
    const {index, subId, time, value, x, y} = pointerEvent.subItem;
    alert([
      `Data point at x = ${x}, y = ${y}`,
      `   Time: ${time}`,
      `   Index: ${index}`,
      `   subID: ${subId}`,
      `   Value: ${value}`,
    ].join('\n'));
  }
});
const handleClick = (pointerEvent) => {
  if (pointerEvent.targetType === 'timeSeriesChart') {
    const {index, subId, time, value, x, y} = pointerEvent.subItem;
    alert([
      `Data point at x = ${x}, y = ${y}`,
      `   Time: ${time}`,
      `   Index: ${index}`,
      `   subID: ${subId}`,
      `   Value: ${value}`,
    ].join('\n'));
  }
}
<Timeline
entities={entities}
events={events}
onTimelineClick={handleClick}
/>
The subId will return a string in the form chartId-index.
Data points don't have a width or height, so these parameters will return undefined.
See the Time Series Chart Tooltips story for an example.
KronoGraph lets you add annotations on events and entity ranges. This provides more context for presentations, investigative workflows or exported timelines. Annotations can also be used to create a collaborative tool between multiple people who share and analyze the same timeline.
Add annotations to your timeline using the annotations annotations API or allow users to make them as they explore the timeline (see Creating annotations).
This example uses a NYC Pizza Slices dataset and shows two annotations loaded into the timeline with the default settings.
Annotations refer to a subject, which can be events or entity ranges, and contain a text label. In the chart above the Great value at Luigi's annotation has an entity range as the subject and the Best tasting pepperoni annotation has two events as the subject. These are defined as follows:
 timeline.annotations({
  note1: {
    subject: ['event36', 'event105'], // subjects are event IDs
    label: 'Best tasting pepperoni'
  },
  note2: {
    subject: [ // subjects are entity IDs and a time range
      {
        id: `Luigi's Pizza`,
        range: { start: Date.UTC(2016, 0, 5), end: Date.UTC(2017, 2, 22) },
      },
    ],
    label: `Great value at Luigi's`,
  },
});
<Timeline
  annotations={
    note1: {
      subject: ['event36', 'event105'], // subjects are event IDs
      label: 'Best tasting pepperoni'
    },
    note2: {
      subject: [ // subjects are entity IDs and a time range
        {
          id: `Luigi's Pizza`,
          range: { start: Date.UTC(2016, 0, 5), end: Date.UTC(2017, 2, 22) },
        },
      ],
      label: `Great value at Luigi's`,
    },
  }
/>
By default, the deleteAnnotation control is displayed. When clicked, it fires an annotations event.
By default, the deleteAnnotation control is displayed. When clicked, it fires an onTimelineChange event.
Annotations are located in their own layer on top of the timeline are only drawn when their subjects are visible. This means that they can optionally be included in an exported image to share offline with others.
Take a look at the Crime Investigation demo to see how annotations can be used.
Annotations can be created live in the timeline by selecting events, and then adding annotations to them:
 // Turn on selection mode
timeline.eventSelectionMode(true);

timeline.on('drag-end', () => {
  const eventIds = timeline.eventSelection();

  if (eventIds.length > 0){
    // Make one annotation pointing at all the selected events
    timeline.annotations({
      myAnnotation: {
        label: 'These events are interesting',
        subject: eventIds
      }
    });
    // Clear the selection
    timeline.eventSelection([]);
    // Exit selection mode
    timeline.eventSelectionMode(false);
  }
});
export const myComponent = () => {
  const [annotations, setAnnotations] = useState({});
  const [eventSelection, setEventSelection] = useState([]);
  // Turn on eventSelection mode
  const [eventSelectionMode, setEventSelectionMode] = useState(true);
  function makeAnnotation(){
    // Make one annotation pointing at all the selected events
    const eventIds = eventSelection;
      if (eventIds.length > 0){
        const myAnnotation = {
            label: 'These events are interesting',
            subject: eventIds
          }
        setAnnotations({myAnnotation});
      }
      // Clear the eventSelection
      setEventSelection([]);
      // Exit eventSelection mode
      setEventSelectionMode(false);
    }

  return (
    <Timeline
    entities={entities}
    events={events}
    onTimelineChange={event => {
      if (event.eventSelection !== undefined) {
        setEventSelection(event.eventSelection);
      }
    }}
    onTimelineDragEnd={makeAnnotation}
    annotations={annotations}
    eventSelection={eventSelection}
    eventSelectionMode={eventSelectionMode}
  />
  )
}
Try it out with the Creating Annotations story.
By default, annotations appear between the timeline data and the scale in a rail at the top of the timeline. However, annotations can also be in the 'bottom' rail or 'free' relative to their event or entity range subjects.
Annotations can be repositioned in the timeline by clicking and dragging, or can be dragged into or out of the rails.
Here, the Best tasting pepperoni annotation position is set to 'bottom', and the Great value at Luigi's annotation has an angle of 'sw' and a distance of '100px'.
 timeline.annotations({
  note1: {
    subject: ['event36', 'event105'],
    label: 'Best tasting pepperoni',
    position: { angle: 'bottom' }, // the annotation is in the bottom rail
  },
  note2: {
    subject: [
      {
        id: `Luigi's Pizza`,
        range: { start: Date.UTC(2016, 0, 5), end: Date.UTC(2017, 2, 22) },
      },
    ],
    label: `Great value at Luigi's`,
    position: { angle: 'sw', distance: 100 }, // the annotation is set relative to the entity range
  },
});
<Timeline
  annotations={
    note1: {
      subject: ['event36', 'event105'],
      label: 'Best tasting pepperoni',
      position: { angle: 'bottom' }, // the annotation is in the bottom rail
    },
    note2: {
      subject: [
        {
          id: `Luigi's Pizza`,
          range: { start: Date.UTC(2016, 0, 5), end: Date.UTC(2017, 2, 22) },
        },
      ],
      label: `Great value at Luigi's`,
      position: { angle: 'sw', distance: 100 }, // the annotation is set relative to the entity range
    },
  }
/>
Settings that affect the size of the rails and annotations can be found in Timeline Options.
The annotation is comprised of two different sections, both of which can be styled:
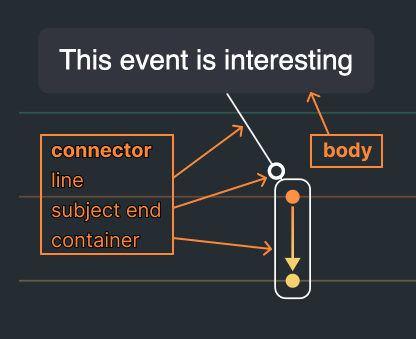
The connector is split into three parts which you can style using the connectorStyle property.
 timeline.annotations({
  note1: {
    // annotation body style settings
    subject: ['event36', 'event105'],
    label: 'Best tasting pepperoni',
    position: { angle: 'w', distance: 100 },
    borderColor: 'orange',
    borderWidth: 2,
    connectorStyle: {
      // annotation connector style settings
      subjectEnd: 'dot',
      container: 'rectangle',
      color: 'orange',
      width: 2,
      lineStyle: 'dashed',
    },
  },
});
<Timeline
  annotations={
    // annotation body style settings
    subject: ['event36', 'event105'],
    label: 'Best tasting pepperoni',
    position: { angle: 'w', distance: 100 },
    borderColor: 'orange',
    borderWidth: 2,
    connectorStyle: {
      // annotation connector style settings
      subjectEnd: 'dot',
      container: 'rectangle',
      color: 'orange',
      width: 2,
      lineStyle: 'dashed',
    },
  }
/>
You can choose to show the delete or edit controls using the deleteAnnotation and editAnnotation control options.
Try out some of the options with the Styling Annotations story.
If you choose to enable the edit control for annotations, you will also need to write application code to edit the label text for the appropriate annotation in the annotations object.
You will need to capture the click event for the edit control. The targetType is
'annotationEditButton' and annotationId property contains the id of the annotation to be edited:
function clickHandler ({ targetType, annotationId }) {
  if (targetType === 'annotationEditButton') {
    console.log(`Annotation to edit: `, annotationId);
  }
}
timeline.on('click', clickHandler);
const handleClick = ({ targetType, annotationId }) => {
  if (targetType === 'annotationEditButton') {
    console.log(`Annotation to edit: `, annotationId);
  }
}
<Timeline
entities={entities}
events={events}
onTimelineClick={handleClick}
/>
Additionally, you will need to create an HTML element to handle the editing, show it when the edit button is clicked, and then save the edited text.
This can be seen in the Creating Annotations story.
Markers allow you to flag a specific time or time range with a line that vertically crosses all the visible entities on the timeline.
Add markers to your timeline by using the timeline.markers API. markers prop. You can add as many markers to your timeline as you like.
By default, markers inherit their colors and text size from the scales options. However, markers can be individually styled by specifying color, fontIcon or labelColor and other options in the Marker object.
timeline.markers([
  {
    label: 'Incident',
    time: { start: new Date(2025, 7, 14, 9, 30), end: new Date(2025, 7, 14, 12, 30) },
  },
  {
    label: 'Resolution',
    time: new Date(2025, 7, 14, 13, 0),
    color: '#a3c096',
    labelColor: '#219ebc',
    fontIcon: { fontFamily: 'Font Awesome 5 Free', fontWeight: 900, text: '\u{f058}' },
    showAtBottom: false,
  },
]);
<Timeline
  markers={[
    {
      label: 'Incident',
      time: {
          start: new Date(2025, 7, 14, 9, 30),
          end: new Date(2025, 7, 14, 12, 30)
        }
    },
    {
      label: 'Resolution',
      time: new Date(2025, 7, 14, 13, 0),
      color: '#a3c096',
      labelColor: '#219ebc',
      fontIcon: { fontFamily: 'Font Awesome 5 Free', fontWeight: 900, text: '\u{f058}' },
      showAtBottom: false,
    }
  }]
  />
See more in the Markers story.
KronoGraph allows you to display font icons on entities, events, glyphs and markers.
Note that font icons on events are only displayed:
You can set a font family on each individual icon with the fontFamily property. Use escaped character code values in the text property to set font icons:
const entities = {
  'Person 1': {
    fontIcon: {
      fontFamily: 'Font Awesome 5 Free',
      fontWeight: 900, // use the 'solid' font icon
      text: '\u{f1b9}', // car icon
    },
  },
};

const events = {
  'email 1': {
    entityIds: ['Person 1'],
    time: new Date(2025, 7, 14, 9, 27),
    fontIcon: {
      fontFamily: 'Font Awesome 5 Free',
      fontWeight: 900,
      text: '\u{f2b6}', // open envelope icon
    },
  },
};
See the Font Icons story for more details.
Fonts must be loaded into the page before they can be used in KronoGraph.
To ensure that KronoGraph is able to render your font icons,
wait for them to load before
calling set().
passing your data to the Timeline component.
There are multiple ways to control font loading, including using dedicated libraries such as Web Font Loader .
Modern browsers also support the native fonts.load() function:
const fontAwesomeSolid = '900 16px "Font Awesome 5 Free"';
document.fonts.load(fontAwesomeSolid);

document.fonts.ready.then(() => {
  const timeline = createTimeline('my-timeline');
  timeline.set({ entities, events });
});
const loadFonts = () => {
  const fontAwesomeSolid = '900 16px "Font Awesome 5 Free"';
  document.fonts.load(fontAwesomeSolid);
};

export const MyComponent = () => {
  const [fontsReady, setFontsReady] = React.useState(false);

  loadFonts();
  document.fonts.ready.then(() => {
    setFontsReady(true);
  });

  if (!fontsReady) {
    return null;
  }

  return (
    <Timeline
      entities={entities}
      events={events}
    />
  );
};
To help with visual analysis of large datasets, KronoGraph offers the option to aggregate individual events into a heatmap. In the heatmap view, individual cells span periods of time in the timeline.
By default, the heatmap cell colors are based on the colors of underlying events and the cell color alpha values (that is, transparency) represent the event count. Customize your heatmaps using Heatmap Values and Heatmap Colors.
The heatmap view shows when there are more than 100 events in the active range. You can change the default number of events with the heatmapThreshold option.
The heatmapDirection option allows you to control how the heatmap shows entity and event connections.
Three options are provided: any (the default), from and to.
| For example, here we see a number of entities and events. | 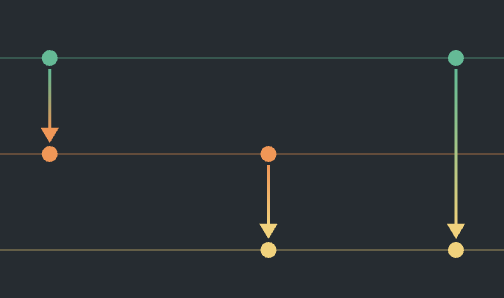 |
With any selected the heatmap will show a cell for all underlying event directions. |  |
With from selected, the heatmap will show cells for entity rows that have events going from them. |  |
With to selected, the heatmap will show cells for entity rows that have events going to them. |  |
Additional options to style the heatmap include heatmapPadding and showLines. Both can be seen in the Styling the Timeline story.
For more examples, see the Heatmap section in our storybook.
You can set a custom value to be used by the heatmap instead of the event count to determine the color of the cells.
Specify this property with the heatmapValue option:
timeline.options({
  events: {
    heatmapValue: 'amount',
  }
});
options{{
  events: {
    heatmapValue: 'amount',
  }
}}
The custom value is defined in the Event object:
const events = {
  event1: {
    entityIds: ['Person 1', 'Person 2'],
    time:  new Date(2025, 7, 14, 9, 27),
    data: {
      amount: 50,
    },
  },
};
const events = {
  event1: {
    entityIds: ['Person 1', 'Person 2'],
    time:  new Date(2025, 7, 14, 9, 27),
    data: {
      amount: 50,
    },
  },
};
KronoGraph also provides heatmapColor options that allow you choose a color scheme for your heatmap. Select options to see how the heatmap is displayed.
| Show: Cell calculation: |
| The default setting uses the event color for the heatmap cells (or the entity color if the events don't have a color assigned). The alpha value is based on the number of events or Heatmap Values. |
See the Heatmap Colors story for more examples for this option.
You can use reveal() to keep events visible when switching to heatmap view or to show events in the context of the heatmap.
You can use reveal() to keep events visible when switching to heatmap view or to show events in the context of the heatmap.
timeline.reveal(['event2', 'event8']);
<Timeline
  reveal={['event2', 'event8']}
/>
In addition, you can use the revealHeatmapAlpha option to fade out entity rows that don't have any revealed events.
timeline.options({
  events: {
    revealHeatmapAlpha: 0.3
  }
});
<Timeline
  options={{
    events: {
      revealHeatmapAlpha: 0.3
    }
  }}
/>
Try it out in the Reveal story.
Note that event folds are unavailable when using reveal.
Information for heatmap cells is available via the subItem object.
When the targetType is 'cell', the subItem object will be returned
with the values for that cell.
timeline.on('click', (pointerEvent) => {
  if (pointerEvent.targetType === 'cell') {
    const {value, x, y, width, height} = pointerEvent.subItem;
    alert([
      `Heatmap cell at x = ${x}, y = ${y}`,
      `   Width: ${width}`,
      `   Height: ${height}`,
      `   Value: ${value}`,
    ].join('\n'));
  }
});
const handleClick = (pointerEvent) => {
  if (pointerEvent.targetType === 'cell') {
    const {value, x, y, width, height} = pointerEvent.subItem;
    alert([
      `Heatmap cell at x = ${x}, y = ${y}`,
      `   Width: ${width}`,
      `   Height: ${height}`,
      `   Value: ${value}`,
    ].join('\n'))
  }
}
<Timeline
entities={entities}
events={events}
onTimelineClick={handleClick}
/>
The subItem parameters index and time are unused by the heatmap and return undefined.
See the Heatmap Tooltips story for ideas
about how to use the subItem object.
KronoGraph lets you respond to different kinds of events fired by the timeline:
To attach an event handler to an event, use the timeline.on() function. To detach it, use timeline.off(). pass your handler functions through to the event props.
When an event fires, KronoGraph passes a single object containing all the details of the event, such as which buttons or EventModifierKeys were active during the event, to the attached event handlers. Use destructuring to extract only the properties you need:
function clickHandler ({ id, button }) {
// the user clicked the left mouse button or tapped on screen
  if (button === 0) {
    console.log(id);
  }
}
timeline.on('click', clickHandler);
const handleClick = ({ id, button }) => {
// the user clicked the left mouse button or tapped on screen
  if (button === 0) {
    console.log(id);
  }
}
<Timeline
entities={entities}
events={events}
onTimelineClick={handleClick}
/>
To prevent default behavior of an event,
call the preventDefault() function in the event handler:
function eventHandler({preventDefault}) {
  // handler code
  preventDefault();
}
const preventDoubleClick = event => {
  event.preventDefault();
};

<Timeline
entities={entities}
events={events}
onTimelineDoubleClick = {preventDoubleClick}
/>
Some events, such as pointer-move or drag-move, fire continuously as the pointer moves. You can add a debouncing or throttling function to control this:
let timer;
function throttle(func, delay) {
  if (timer) return;
  timer = setTimeout(() => {
    func();
    timer = undefined;
  }, delay);
}
// throttle eventHandlerFunction to only run once every 100ms
timeline.on('pointer-move',() => {
  throttle(eventHandlerFunction, 100);
});
See a complete list of the available events events in the API Reference.
Check out the Events story to see events in action.
When a user interacts with some types of items on the timeline, an event will return a subItem object in its handler that contains more information about the sub-item.
if (targetType === 'timeSeriesChart' && subItem) {
  const { x, y, value, time } = subItem;
  console.log(x, y, value, time);
}
KronoGraph returns a sub-item object for Heatmap Cells and Data Points.
There are a number of formats to represent time, which means that each dataset you load into KronoGraph may need to be handled differently. You will need to convert your time into a Date object or a millisecond number. Standard JavaScript handles time down to millisecond resolution, which is one thousandth of a second.
 const date1 = new Date(2022, 11, 14); // year, month, day
 const date2 = Date.UTC(2022, 11, 14); // 1670976000000 milliseconds
KronoGraph will always return dates as Date objects. You can then convert them into the format that suits you best.
const isoDate1 = date1.toISOString(); // 2022-12-14T00:00:00.000Z
For the majority of applications, milliseconds show sufficient time resolution to display your data. However, in some cases, milliseconds just aren't granular enough.
KronoGraph allows for the use of nanoseconds (1⁄1000000000 of a second, or 10−9 seconds) by accepting and returning an extra value in addition to standard date values to account for these smaller fractions of seconds.
Depending on how time is recorded in your data, it is possible to break date strings into a Date object and a number of nanoseconds, shown in the following example:
const str = "Sep 24, 2019 17:56:40.563420880";

// split the date string at the decimal point into a date and a fraction of a second
const [dateText, fractionText] = str.split(".");

// convert "Sep 24, 2019 17:56:40" to a Date object
const time = new Date(dateText);

// make sure that the nanosecond portion of the date string has nine decimal places
// by adding zeros if needed
const nanosecondsText = fractionText.padEnd(9, "0");

// convert the nanoseconds text string to a number
const nanoseconds = Number(nanosecondsText);
See the MDN docs for more information about manipulating strings.
You can then assign the values to the appropriate time properties, in this case to time and timeNanoseconds.
Depending on the Scale Localization options you are using, the timeline could
appear as below:
 const timelineData = {
  entities: {
    ent1: { label: 'Entity 1', },
    ent2: { label: 'Entity 2', },
  },
  events: {
    evt1: {
      entityIds: ['ent1', 'ent2'],
      time: new Date('Sep 24, 2019 17:56:40'),
      timeNanoseconds: 563420880,
      color: '#FF8838',
    },
  },
};
Take a look at the Higher Resolution Time story for an example.
If you use a timeNanoseconds value, KronoGraph will select a resolution to display the data depending on the values supplied.
There are three levels of resolution available:
KronoGraph will use the resolution required, so long as the time range of your data does not exceed the range limits for that resolution. The range limits are as follows:
| Resolution | Range limits | ~ Range |
|---|---|---|
| Milliseconds | 00:00 1 January 1970 UTC ± 100,000,000 days | 547,945 years |
| Microseconds | A chosen midway point in the data ± 253 microseconds | 570 years |
| Nanoseconds | A chosen midway point in the data ± 253 nanoseconds | 208 days |
If the time range exceeds these limits, KronoGraph will use the next best resolution.
A warning message will appear in the developer console unless the
showWarnings option is set to false.
Every geographical region has its own standard time zone. Each zone has a UTC offset, which is the difference in hours and minutes from Universal Coordinated Time (UTC). Many regions observe Daylight Saving Time (DST), where the offset changes during the seasons. Offset rules may also change for unpredictable political reasons.
JavaScript has no built-in functionality to manage multiple time zones, but it does have functionality to map between UTC and the user's local time zone, defined by the operating system.
The JavaScript Date constructor treats most input formats as local time. The exceptions are single dateStrings with a declared time zone and millisecond numbers, which use UTC. See the MDN Docs for more details.
If you are using timeNanoseconds, the value will remain the same regardless of the time zone.
KronoGraph also has no built-in functionality to manage time zones, and will display dates exactly as they're passed in.
You will need to decide which time zone to use for KronoGraph events. The most common choices are either the user’s time zone or UTC.
See Scale Localization for information about displaying dates and times using different formats.
Sometimes users want to see dates in their local time zone. If your server stores dates with time zones, simply pass the dates directly to the client:
// serverside
const storedDate = '2016-05-22T15:58:33.592Z';
// send storedDate directly to client
Then create a JavaScript Date object:
// clientside
const dateToUse = new Date(storedDate);
timeline.markers([{ label: 'dateInLocalTime', time: dateToUse }]);
KronoGraph will then display the date in the user’s time zone.
If your dates don’t have time zones, when JavaScript creates the date object it will assume the date is in local time already:
// clientside
// date string without a time zone
const zonelessDateString = 'Mon, 11 May 2015 15:00:00';
// date will be shown in the user’s time zone.
const dateInLocalTime = new Date(zonelessDateString);
KronoGraph will then display the date as 3pm in the user’s time zone.
If users are used to seeing dates in UTC or another time zone, you may want to convert the date to that time zone.
If users want dates in a specific time zone, it's best to convert on the server before sending the data.
We recommend using a library such as Moment.js to assist with managing time zone conversions.
For a date on the server:
// serverside
const storedDate = '2016-05-22T07:58:33.592Z';
Convert this to local time on the server:
// serverside
const convertedDate = myCustomDateConverter(storedDate);
// send convertedDate to client
The data arrives in local time:
// clientside
// this assumes convertedDate is a string
const dateToUse = new Date(convertedDate.time);
timeline.markers([{ label: 'dateInConvertedTime', time: dateToUse }]);
Passing this value to KronoGraph will display dates in the converted time.
KronoGraph interprets numbers as time in milliseconds since January 1, 1970, 00:00:00 UTC, and displays them in UTC. This means they are shown as the same time for users in all time zones.
If you construct a date object with a millisecond number JavaScript will convert this to local time and you will get a different date than if you use the millisecond value itself:
// ms number is UTC
const milliseconds = 1431356400000;
const event1time =  milliseconds;
// Date object is local time
const event2time = new Date(milliseconds);
Dates returned by the timeline API are in local time. You can convert these back to milliseconds:
const returnedDate = new Date(2023, 0, 1, 14, 30); // local time

// convert to UTC milliseconds
const ms = Date.UTC(
returnedDate.getFullYear(),
returnedDate.getMonth(),
returnedDate.getDate(),
returnedDate.getHours(),
returnedDate.getMinutes(),
returnedDate.getSeconds(),
returnedDate.getMilliseconds(),
);
// 1672583400000
The timeline scale allows you to see when events occur and helps you navigate the timeline.
A linear scale is used by default, showing each individual time period, such as an hour, as the same width as any other.
Sometimes, however, events happen over multiple, separate intervals, in which case, a nonlinear scale, that condenses time periods without any events, can be useful.
This choice of scale, is referred to as the scale mode.
Similarly, sometimes, you might want to explore how events repeat over a period, such as a day or week. This is controlled using scale wrapping, sometimes referred to as "pattern of life" analysis.
By default, KronoGraph spaces events along the timeline in relation to a linear scale. However, a dataset
might have lots of events clustered closely together, followed by periods where no events occur. If this is the case, it can be useful to
change the scaleMode to nonlinear to space the events proportionally,
reduce the amount of empty space and allow for a larger time range to be seen at once.
The following timeline shows the dates of notable inventions and uses the nonlinear scale to stretch and compress time where needed, allowing more inventions to be shown in the same view. For example, there are more than 1500 years between the invention of paper and the printing press, but the nonlinear scale mode compresses the gap to make better use of the space in the timeline. Hover over the timeline and use the scale guide to see the year of each invention.
timeline.options({
  scales: {
      scaleMode: 'nonlinear'
  }
});
<Timeline
  options={{
    scales: {
      scaleMode: 'nonlinear'
    }
  }}
/>
By default, when an entity is focused, the timeline is rescaled for visible events. Disable this behavior by setting the rescale option to 'false'.
See the Nonlinear Scale Mode story to try it out.
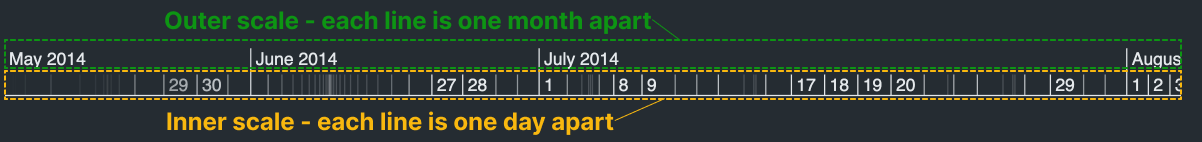
The nonlinear scale is made up of an inner and outer scale. The outer scale gives context while the inner scale provides a more accurate indication of the date and time. Each vertical tick mark is drawn at a regular time interval, which shows how much time is compressed or expanded on the scale.
Customize the display of the scale with dateOrder and twelveHourClock. Currently, dateTimeFormats and dateTimeNames aren't supported using the nonlinear scale.
Note that when the scale mode is set to 'nonlinear', time series charts will be hidden.
By default, the timeline shows time progressing, and displays events in the order in which they occurred, using a linear timescale (see also Scale Mode).
Sometimes, however, rather than seeing events sequentially, you might want to see how they occur by day of the week, or by date of the month. KronoGraph allows you to do this by using scale wrapping, enabling you to visualize and investigate repeating patterns, sometimes referred to as "pattern of life" analysis.
The following example shows how events occurring over many months can be visualized according to what time of the week they happened.
You can zoom in to see detail but, you can't zoom out any further than a week (as that's what your scale is being wrapped by).
You can change the timeline's scale wrapping by setting the wrapping option, for example:
options={{
  scales: {
    wrapping: 'week'
  }
}}
timeline.options({
  scales: {
    wrapping: 'week'
  }
});
KronoGraph provides the following scale wrapping options:
| Wrapping Option | Length of Scale | How Events are Positioned |
|---|---|---|
day | One day | By the hour of day at which they occurred |
week | One week | By the elapsed time since the start of their week |
month | 31 days | According to the date they occur within their month |
year | One year | By the elapsed time since the start of their year |
When scale wrapping is used:
If no events have occurred in that time period, an empty timeline is displayed.
Internally, scale wrapping uses a "base range" of times for each wrapping option, which it maps event times to. If you call timeline.range() If an onTimelineChange event containing a range object is invoked when the scale is wrapped, the times in the returned range event's range object are relative to this.
The base ranges for each wrapping option are:
| Wrapping | Start | End |
|---|---|---|
day | 12 am on Jan 1, 2000 | 12 am on Jan 2, 2000 |
week | 12 am on Monday, Jan 3, 2000 | 12 am on Monday, Jan 10, 2000 |
month | 12 am on Jan 1, 2000 | 12 am on Feb 1, 2000 |
year | 12 am on Jan 1, 2000 | 12 am on Jan 1, 2001 |
So, for example, if wrapping by week, and
zooming in to 'Tuesday',
timeline.range()
the TimeRange object
returns a start date of 12 am, January 4, 2000, and an end date of 12 am,
January 5, 2000 (which was a Tuesday). Conversely, if you
call timeline.range() as a setter,
pass a value to the range prop,
the dates you provide should be relative to the base range.
Timestamps passed to event handlers for UI events such as click or hover onTimelineClick or onTimelineHover are also relative to the base range.
Check out the Scale Wrapping story to see an example of scale wrapping in action.
Note that if scale wrapping is applied, time series charts will be hidden.
Dates and times are displayed in the scale in US English format by default. You can use the dateOrder and twelveHourClock options for basic adjustment of the US English format.
For further customization of the displayed date and time you can use:
timeline.options({
  scales: {
    dateTimeFormats: {
      date: 'yyyy-MM-dd',
    },
  },
});
You can see some examples of date and time formatting for different locales in the Scales Options story.
In order to display your data in KronoGraph, you need to transform it into JSON format.
This example shows how to convert a CSV file to the correct JSON format, but a similar method can be applied whatever the format of your original data.
In our example, we're using mini-dish.csv, delivered in the downloaded KG package. It's a subset of data from the now-retired
"What's on the menu?"
project, originally hosted by the New York Public Library.
The code below uses the NPM packages csvtojson and fs-extra to help transform and save the appropriate file.
const csvtojson = require('csvtojson');
const fs = require('fs-extra');

async function transformData() {
  // read the csv file
  const csvData = await csvtojson().fromFile('mini-dish.csv');
  // create an empty object for events
  const events = {};
  // create an empty object for entities
  const entities = {};

  // iterate through the csv data and assign the
  // values in the file to the appropriate API
  csvData.forEach(({ name, first_appeared, last_appeared, highest_price }, index) => {
    // add data to the event object
    events[`event${index}`] = {
      entityIds: [name],
      time: {
        start: Date.parse(first_appeared),
        end: Date.parse(last_appeared),
      },
    };

    // calculate the color of the entity based on the highest_price value
    let color;
    if (highest_price === '0') {
      color = '#ff9147';
    } else if (highest_price > '0' && highest_price <= '0.5') {
      color = '#f7d06e';
    } else {
      color = '#e12d39';
    }
    // add data to the entity object
    entities[name] = {
      color,
    };
  });
  // create a data object containing the events and entities objects
  const data = { events, entities };
  // write the JSON file
  await fs.writeJSON('dishes-data.json', data);
}

transformData();
This is the result of the transformation - a JSON file.
Once the JSON file is correctly formatted it can be used to create a timeline:
 import { createTimeline } from 'kronograph';
 const data = require('dishes-data.json');

 const timeline = createTimeline('handlingDataExample');

 timeline.set(data);
 timeline.fit();
The timeline would look like this:
On every render, KronoGraph must decide whether any of its props have changed and what to update accordingly.
KronoGraph must decide if any data has changed every time the API is called, and make the respective updates.
The timeline assumes that whenever a new object is passed into a
prop,
property,
something has changed and KronoGraph will redraw.
If the same object is passed into
a prop,
set(),
it assumes nothing has changed, even if the object itself has been altered.
By relying on referential equality to detect changes, KronoGraph can quickly and efficiently respond to re-renders, even in very large data sets.
This means that applications must be disciplined in how state is updated to prevent unnecessary redraws being called. For example, passing a new object with identical property values into the entities prop property will trigger the data to be reloaded and redrawn.
This holds true across the state tree: if a sub property has changed, a whole new object hierarchy must be created and passed into the relevant prop. property. Consider the following object in the entities prop: property:
const entities = {
  'smith-j' : {
    label: 'John Smith',
    fontIcon: {
      text: '☺',
    },
  },
};
To change John Smith's fontIcon.text property, we can't
simply mutate the first object and pass the same into the entities
prop,
property,
as the change will not be recognized and our timeline will
stay the same.
To correctly render this change, we have to create new objects
for entities, smith-j (i.e. entities['smith-j']),
and fontIcon.
We also need to create a new parent object to pass to set().
In the object below, we've starred the
properties that need to be re-created:
const entities* = {
  'smith-j'* : {
    label: 'John Smith',
    fontIcon*: {
      text: '☺',
    },
  },
};
In a real app, we would have something like:
// Clone the entities object before making any changes
const newEntities = Object.assign({}, this.state.entities);

// Clone and update the entity we want to change
const newEntity = Object.assign({}, newEntities['smith-j'], {
  fontIcon: {
    ...newEntities['smith-j'].fontIcon,
    text: '$',
  }
});

// Write the change back to the newEntities object
newEntities['smith-j'] = newEntity;

// Update app state and trigger a re-render
this.setState({ entities: newEntities });
// In this example, we assume that the app has a 'let currentData'
// variable containing an object with properties
// 'entities', 'events', 'entityTypes' and 'eventTypes'.

// Clone the entities object before making any changes
const newEntities = Object.assign({}, currentData.entities);

// Clone and update the entity we want to change
const newEntity = Object.assign({}, newEntities['smith-j'], {
  fontIcon: {
    ...newEntities['smith-j'].fontIcon,
    text: '$',
  }
});

// Write the change back to newEntities
newEntities['smith-j'] = newEntity;

// Update the app's currentData object with the changed
// entities object and pass the new object to the timeline.
currentData = { ...currentData, entities: newEntities }
timeline.set(currentData);
For an example of passing state changes in and out of the Timeline component,
see the Change Event story.
Using immutability in your app's code provides better performance, fewer unexpected side-effects, and allows you to rewind or undo user actions.
There are many code patterns and functions designed for immutability, including:
Object.assign()const events = {...this.state.events};
const events = { ...state.events };map and filterWe use these patterns throughout our stories.
Additional methods are available on timeline objects when
you have a reference to an instance of a timeline.
Refs provide a way to access React elements created in
the render method. For example, when you have a ref
to a timeline, you can call the fit method which
will adjust the view to make all timeline items visible.
See the API Reference
for more details.
This example uses the React.createRef() API, introduced in React 16.3.
If you are using an earlier release of React we recommend using
callback refs
instead.
class MyStatefulComponent extends React.PureComponent {
  constructor(props) {
    super(props);
    this.timeline = React.createRef();
  }

  fitToView = () => {
    this.timeline.current.fit();
  };

  render = () => {
    const { items } = this.props;
    return (
      <>
        <Timeline ref={this.timeline} items={items} />
        <button onClick={this.fitToView}>
          Show all items
        </button>
      </>
    );
  };
}
If you are using React 16.8 or above then you have access to the hooks API and can use the
useRef() hook in your functional components.
const MyFunctionalComponent = (props) => {
  const { items } = props;
  const timelineRef = React.useRef(null);

  const fitToView = () => {
    timelineRef.current.fit();
  };

  return (
    <>
      <Timeline ref={timelineRef} items={items} />
      <button onClick={fitToView}>
        Show all items
      </button>
    </>
  );
};
If KronoGraph is being used for investigative work, you may want to be able to reproduce a particular view of the timeline in order to show how a specific conclusion was reached.
KronoGraph enables you to:
You can export a static png image of your current timeline view using the export function.
import { createTimeline } from 'kronograph';
import { data } from './data';

const timeline = createTimeline('my-timeline');
timeline.set(data);
timeline.fit();
timeline.export({ type: 'png' }).then(({url}) => {
  window.open(url);
});
You can export a static png image of your current timeline view using the export instance method.
import React, {useEffect, useRef} from 'react';
import Timeline from 'kronograph/react/Timeline';
import { entities, events, markers } from './data';

export const Demo = () => {
  const timelineRef = useRef(null);

  useEffect(() => {
    timelineRef.current.export({type: 'png'}).then(({url}) => {
      window.open(url);
    })
  });

  return <Timeline
            ref={timelineRef}
            events={events}
            entities={entities}
            markers={markers}
          />;
};
Try exporting a timeline in our Export to PNG story.
If you want to save the current timeline component as a snapshot so that you can come back to it at a later date, and reload it exactly as it was, use the serialize function. serialize.
You can then use the load(snapshot) function the spread operator to restore the timeline to exactly how it was. This is illustrated in the Save/Load Snapshot story.
KronoGraph is a low-risk, highly secure JavaScript library that is unlikely to be affected by common security vulnerabilities:
KronoGraph is a closed source project, with all code controlled by Cambridge Intelligence staff, reviewed by multiple expert developers and tested thoroughly by our experienced QA team.
KronoGraph source code is developed in TypeScript and built using automated tools including a linter (ESlint ) and a suite of security scanners, including:
If we identify a vulnerability, we review it internally and deal with it before release.
There is no accepted standard scanner for malicious JavaScript code. Our JavaScript files are built using secure processes and hosted on secure web servers. We will never add malicious behaviors to our source code, and we are confident that third parties cannot hijack or compromise our downloads.
The KronoGraph Timeline component requires
React .
You can install it using yarn:
npm install --save react@^19.0.0
KronoGraph supports React versions ^16.8.0, ^17.0.0, ^18.0.0 and ^19.0.0.
KronoGraph includes full type definitions for TypeScript compatibility.
See kronograph.d.tsTimeline.d.ts for the definitions.
Types should be automatically available when you import KronoGraph.
Cambridge Intelligence has implemented an information security management system that is certified to ISO 27001:2022 for the operations of software development, sale and associated support, all information assets processed and managed and all systems and services where information is processed by Cambridge Intelligence.
This includes:
For further information, please contact our security team.
Designing accessible products means they can be used effectively by as many people as possible, providing an inclusive experience for people with impairments and different needs.
Accessible design improves the product for everyone, as well as creating a better user experience for users with disabilities. In addition, most countries support accessibility with laws and regulations on both public and private sector organizations.
There is no single universal standard, so we recommend that you always check what policies are relevant for you. However, the W3C's Web Content Accessibility Guidelines 2.1 are most often referenced as an acceptable standard.
KronoGraph is not a complete application by itself, it is a toolkit that you integrate into your own product. This means that accessibility should be considered at the level of the end product to give your application users the best user experience possible.
KronoGraph as a visual medium is often exempt from compliance requirements because the functionality cannot always be fully reproduced in an accessible way. To help you with your accessibility audits, we have prepared a table that summarizes the guidelines of WCAG 2.1 and how they relate to KronoGraph:
We are always working on implementing features that make KronoGraph more accessible and easier to use. Some tips using various KronoGraph features are listed below.
KronoGraph doesn't have any native keyboard navigation behavior, which means that you can customize keyboard controls without having to override any default actions. To help you do this, KronoGraph offers a number of native events that you can respond to. It also supports standard element events such as key-down, focus and others.
KronoGraph doesn't have any native keyboard navigation behavior, which means that you can customize keyboard controls without having to override any default actions. To help you do this, KronoGraph offers a number of native events that you can respond to. It also supports standard element events such as onTimelineKeyDown and others.
This example shows how to customize keyboard navigation behavior
by calling pan() and zoom() in a handler triggered by
a key-down event listener:
This example shows how to customize keyboard navigation behavior
by calling the pan() and zoom() instance methods
in a handler triggered by a onTimelineKeyDown event listener:
 timeline.on('key-down', keydownHandler);

 function keydownHandler(e) {
   if (e.keyCode === 37) {
     timeline.pan('left');
   } else if (e.keyCode === 39) {
     timeline.pan('right');
   } else if (e.keyCode === 73) {
     timeline.zoom('in');
   } else if (e.keyCode === 79) {
     timeline.zoom('out');
   }
 }
 const timelineRef = useRef(null);
 const handleKeyDown = (e) => {
   if (e.keyCode === 37) {
     timelineRef.current.pan('left');
   } else if (e.keyCode === 39) {
     timelineRef.current.pan('right');
   } else if (e.keyCode === 73) {
     timelineRef.current.zoom('in');
   } else if (e.keyCode === 79) {
     timelineRef.current.zoom('out');
   }
 }
 <Timeline
 entities={entities}
 events={events}
 onTimelineKeyDown={handleKeyDown}
 />
Some browsers support some keyboard navigation by default, e.g. using the Tab key to iterate through form controls. When planning keyboard shortcuts, you should avoid overriding native browser and operating system shortcuts that affect the browser behavior.
We recommend using simple sans-serif fonts as they are generally easier to read for most users. Alongside text, you should also convey the meaning in another way that doesn't require reading or understanding the language, such as font icons or glyphs.
The colors you use should always have a sufficient contrast ratio. Online tools such as this WebAIM Contrast checker can help you check your color combinations for accessibility. Special attention should be paid to contrast if users can switch between dark and light modes.
You should not rely on a single method, such as color, to convey a meaning. Add as many markers for context or tooltips for extra information as needed. On entities you can use glyphs and font icons, while on events you can use font icons.
Entities can be arranged into types and groups to help users understand how they are related to each other.
ARIA (Accessible Rich Internet Applications), is a set of roles and attributes that can supplement HTML elements or attributes that don't have built-in accessible semantics or behavior.
KronoGraph lets you set ARIA properties, such as aria-label, on the DOM element.
 const labelAria = document.getElementById('KronoGraph-timeline');
 const entityCount = Object.keys(timelineData.entities).length;
 if (labelAria) {
   labelAria.setAttribute(
     'aria-label',
     `KronoGraph timeline showing ${entityCount} entities.`,
   );
 }
Seeing the timeline is essential for spotting and understanding the
patterns and connections revealed in the data,
which makes it challenging to make timelines accessible e.g. for screen readers.
As an alternative, you can hide the timeline's div from screen readers
using the aria-hidden property, and instead supply a text in the aria-description
that summarizes the timeline to the extent needed in your context, for example:
The element here is a timeline made of entities and events, where entities represent employees and events represent their communications.
You can also use audio as an additional channel to written information or as an extra method of alerting or highlighting, but remember to never rely on audio alone. Click on an entity or an event to hear the name or time described.
 function clickHandler(event) {
  const msg = new SpeechSynthesisUtterance();
  if (event.targetType === 'entity') {
    msg.text = event.label;
  } else if (event.targetType === 'event') {
    msg.text = event.time;
  }
  if (msg) {
    window.speechSynthesis.speak(msg);
  }
}

const timeline = createTimeline('accessibilityAudio');
timeline.set(timelineData);
timeline.fit();
timeline.markers([{ label: 'Company announcement.', time: new Date(2025, 7, 14, 8, 56, 2) }]);
timeline.options({ scales: { showAtBottom: false } });
timeline.on('click', clickHandler);
 const clickHandler = ({targetType, label, time}) => {
  const msg = new SpeechSynthesisUtterance();
  if (targetType === 'entity') {
    msg.text = label;
  } else if (targetType === 'event') {
    msg.text = time;
  }
  if (msg) {
    window.speechSynthesis.speak(msg);
  }
}

<Timeline
  entities={entities}
  events={events}
  markers={ [{ label: 'Company announcement.', time: new Date(2025, 7, 14, 8, 56, 2) }]}
  options={{scales: {showAtBottom: false}}}
  onTimelineClick={clickHandler}
/>
KronoGraph 2.0 changes the way data is displayed and how users interact with it. This guide gives an overview of these changes to help you upgrade and make the most of the new features.
The key changes are:
There are no breaking changes to the KronoGraph data format,
so you should be able to load your data into KronoGraph 2.0 without issues.
However, your data may look very different, especially if you have
more entities than can fit on the screen at one time. You may want to think about how to
communicate this to your end users.
In earlier versions, when the timeline contained more entities than could fit on the screen, KronoGraph collapsed entities into 'runs', or, if you've defined types or groups in your data, 'closed groups'. Both were opened using the expand control.
Our users suggested that closed groups could sometimes open and close unpredictably when navigating the timeline, and that the design of narrow bands of data with lots of white space above and below could be improved.
KronoGraph 2.0 draws all entities and their events, even if there isn't enough space to display each entity label. This results in an immediate visual impact from a dataset, with heatmaps that convey all your data from the first glance.
If there are too many rows to label, instead of groups users can now open and close the lens. The lens enlarges a small set of entities in the timeline center and lets you scroll up and down through the whole dataset.
For any help implementing the changes, please contact support.
Below is a list of suggestions to help you migrate:
If you don't have types or groups defined in your data, consider adding them to visually split up large datasets and to label the split data when there isn't enough space to label individual entities.
New lens event returns the id of the entity at the center of the lens. Use the event to track the data that is currently in view.
New lens property returned with the onTimelineChange object
provides the id of the entity at the center of the lens. Use the property to track the data that is currently in view.
New 'lensScrollbar' and 'lensControl' targetType values are returned from pointer events
when the user interacts with the lens scroll bar or the lens control.
Check your event handler code to ensure the behavior is as you expect during the user interaction.
New 'lensScrollBar' dragType is returned from pointer events
when the user interacts with the lens scroll bar.
Check your event handler code to ensure the behavior is as you expect during the user interaction.
A new label property is added to the object passed to pointer event handlers which helps you determine
if an entity is drawn large enough for labels and interactions, or if it's too small to be shown fully.
For example, if you're adding tooltips or annotations,
you may want to only display them against entities that have a label.
Although we strongly recommend using the new lens feature, you can still recreate 'closed groups' of entities by manipulating your data.
To force a group of entities into a single row, you can replace their ids in the entityIds property of events with a new entity id representing a summary row and add this new entity to your entity list.
All APIs referencing open and closed groups have been removed. If you have any code which references them, you'll need to remove or modify it:
expand eventexpandedRowIdexpand option of controlstargetType values: 'collapse', 'expand', 'entityGroupMore', 'entityGroupRun'In addition, the priority option of entityType
remains in the API for file format compatibility but it doesn't have any effect.
We've removed support for the focus action on groups, based on feedback that users were unsure what focusing a group meant or how to undo it. We recommend using filtering instead - if you want the user to see only the events associated with a certain group, filter other events out of your data. You can also programmatically focus all the entities in a group using the focus API. You can also programmatically focus all the entities in a group using the focus API.
The pointer-move event now fires when the timeline moves beneath the pointer, as well as when the pointer moves over the timeline. This synchronizes your tooltips and annotations with moving timeline. No migration is required, but you can check that your tooltips and annotations behave as expected.
The onTimeLinePointerMove event is now invoked when the timeline moves beneath the pointer, as well as when the pointer moves over the timeline. This synchronizes your tooltips and annotations with moving timeline. No migration is required, but you can check that your tooltips and annotations behave as expected.
We've changed some default settings to reduce visual clutter and make our event folds feature for simultaneous events more discoverable:
| API | Default before 2.0 | KronoGraph 2.0 default |
|---|---|---|
| color | 'inverse' | 'entity' |
| heatmapPadding | false | true |
| heatmapThreshold | 250 | 100 |
| showCircles | true | false |
| showEventFolds | false | true |
| showLines | 'always' | 'individualEvents' |
| standardRowHeight | 18 | 24 |
KronoGraph source code must be obscured within your application. To prevent it being accessed or reused by third parties you need to:
Before deploying your code, check that:
KronoGraph is always in development, so we add, improve and remove features based on the needs of our products and customers.
Some features might first be introduced as alpha or beta before they become a stable part of KronoGraph. However, any new feature will be fully tested.
Sometimes we need to deprecate APIs and make breaking changes.
Alpha features will be marked in the API using an Alpha tag.
If you need any help with an alpha feature please contact support.
Beta features will be marked in the API using a beta tag.
Once we've made all intended improvements to beta features, they move out of beta and become a stable part of KronoGraph.
If you need any help with a beta feature please contact support.
Deprecated features will be marked in the API using a deprecated tag.
If you need any help with a deprecated feature please contact support.
Breaking changes could be an API update, a replacement feature or a visual change. They can cause your application to stop working.
If you need any help with a breaking change please contact support.
This website is built using the following libraries and assets:
| Babel | MIT |
| date-fns | MIT |
| Esri Leaflet | Apache 2.0 |
| Font Awesome Font | SIL OFL 1.1 |
| Font Awesome Icons | CC BY 4.0 |
| Fuse.js | Apache 2.0 |
| Icofont Font | SIL OFL 1.1 |
| Leaflet | BSD 2-Clause |
| Litepicker | MIT |
| Lodash | MIT |
| lz-string | MIT |
| Material Design Icons Font | SIL OFL 1.1 |
| Material UI | MIT |
| Monaco Editor | MIT |
| Muli Font | SIL OFL 1.1 |
| Raleway Font | SIL OFL 1.1 |
| React | MIT |
| React DOM | MIT |
| react-split-pane | MIT |
| Rollup | MIT |
| Storybook | MIT |
| Web Font Loader | Apache 2.0 |
| WHATWG fetch polyfill | MIT |
Please note that KronoGraph itself only has one dependency: React. This is only required when using the React version of KronoGraph.
We also make use of the following data sets in our examples:
The social media demo makes use of the following images:
 to close lens view.